Two setup paths
| Path | Best for | How to configure |
|---|---|---|
| Local CLI | Self-hosted opensre on your laptop or server | opensre onboard or opensre integrations setup, plus env vars |
| Hosted (OpenSRE Cloud) | Org-wide connectors shared across users | app.tracer.cloud web app |
Local CLI setup
Verify
/integrations list, /integrations verify <name>, and /health.
Integration catalog
| Category | Integrations |
|---|---|
| Observability and incidents | Alertmanager, Azure Monitor, Better Stack, Coralogix, Datadog, Grafana, Hermes, Honeycomb, Incident.io, OpenObserve, OpsGenie, Sentry, SignOz, Splunk, Victoria Logs |
| Cloud and infrastructure | AWS, Argo CD, Helm, Jenkins, Vercel |
| Databases and data platforms | Azure SQL, ClickHouse, Kafka, MariaDB, MongoDB, MongoDB Atlas, MySQL, OpenSearch, PostgreSQL, RabbitMQ, RDS, Snowflake, Supabase |
| Source control and collaboration | Bitbucket, GitHub, GitHub Actions, GitLab, Google Docs, Jira, Trello |
| Workflow orchestration | Airflow, Dagster, Prefect |
| Messaging | Slack, Discord, Telegram, WhatsApp, Twilio SMS |
| AI coding assistants | OpenClaw |
Hosted (OpenSRE Cloud) setup
Enterprise connectors are configured through the OpenSRE web app at app.tracer.cloud. Once connected, they are available to all users in your organization. Observability. Connect Grafana and Datadog for logs, metrics, traces, and alerts. Infrastructure. Connect AWS to map your environment across clouds and clusters. Communication. Deliver investigation reports via Slack, Discord, or Telegram.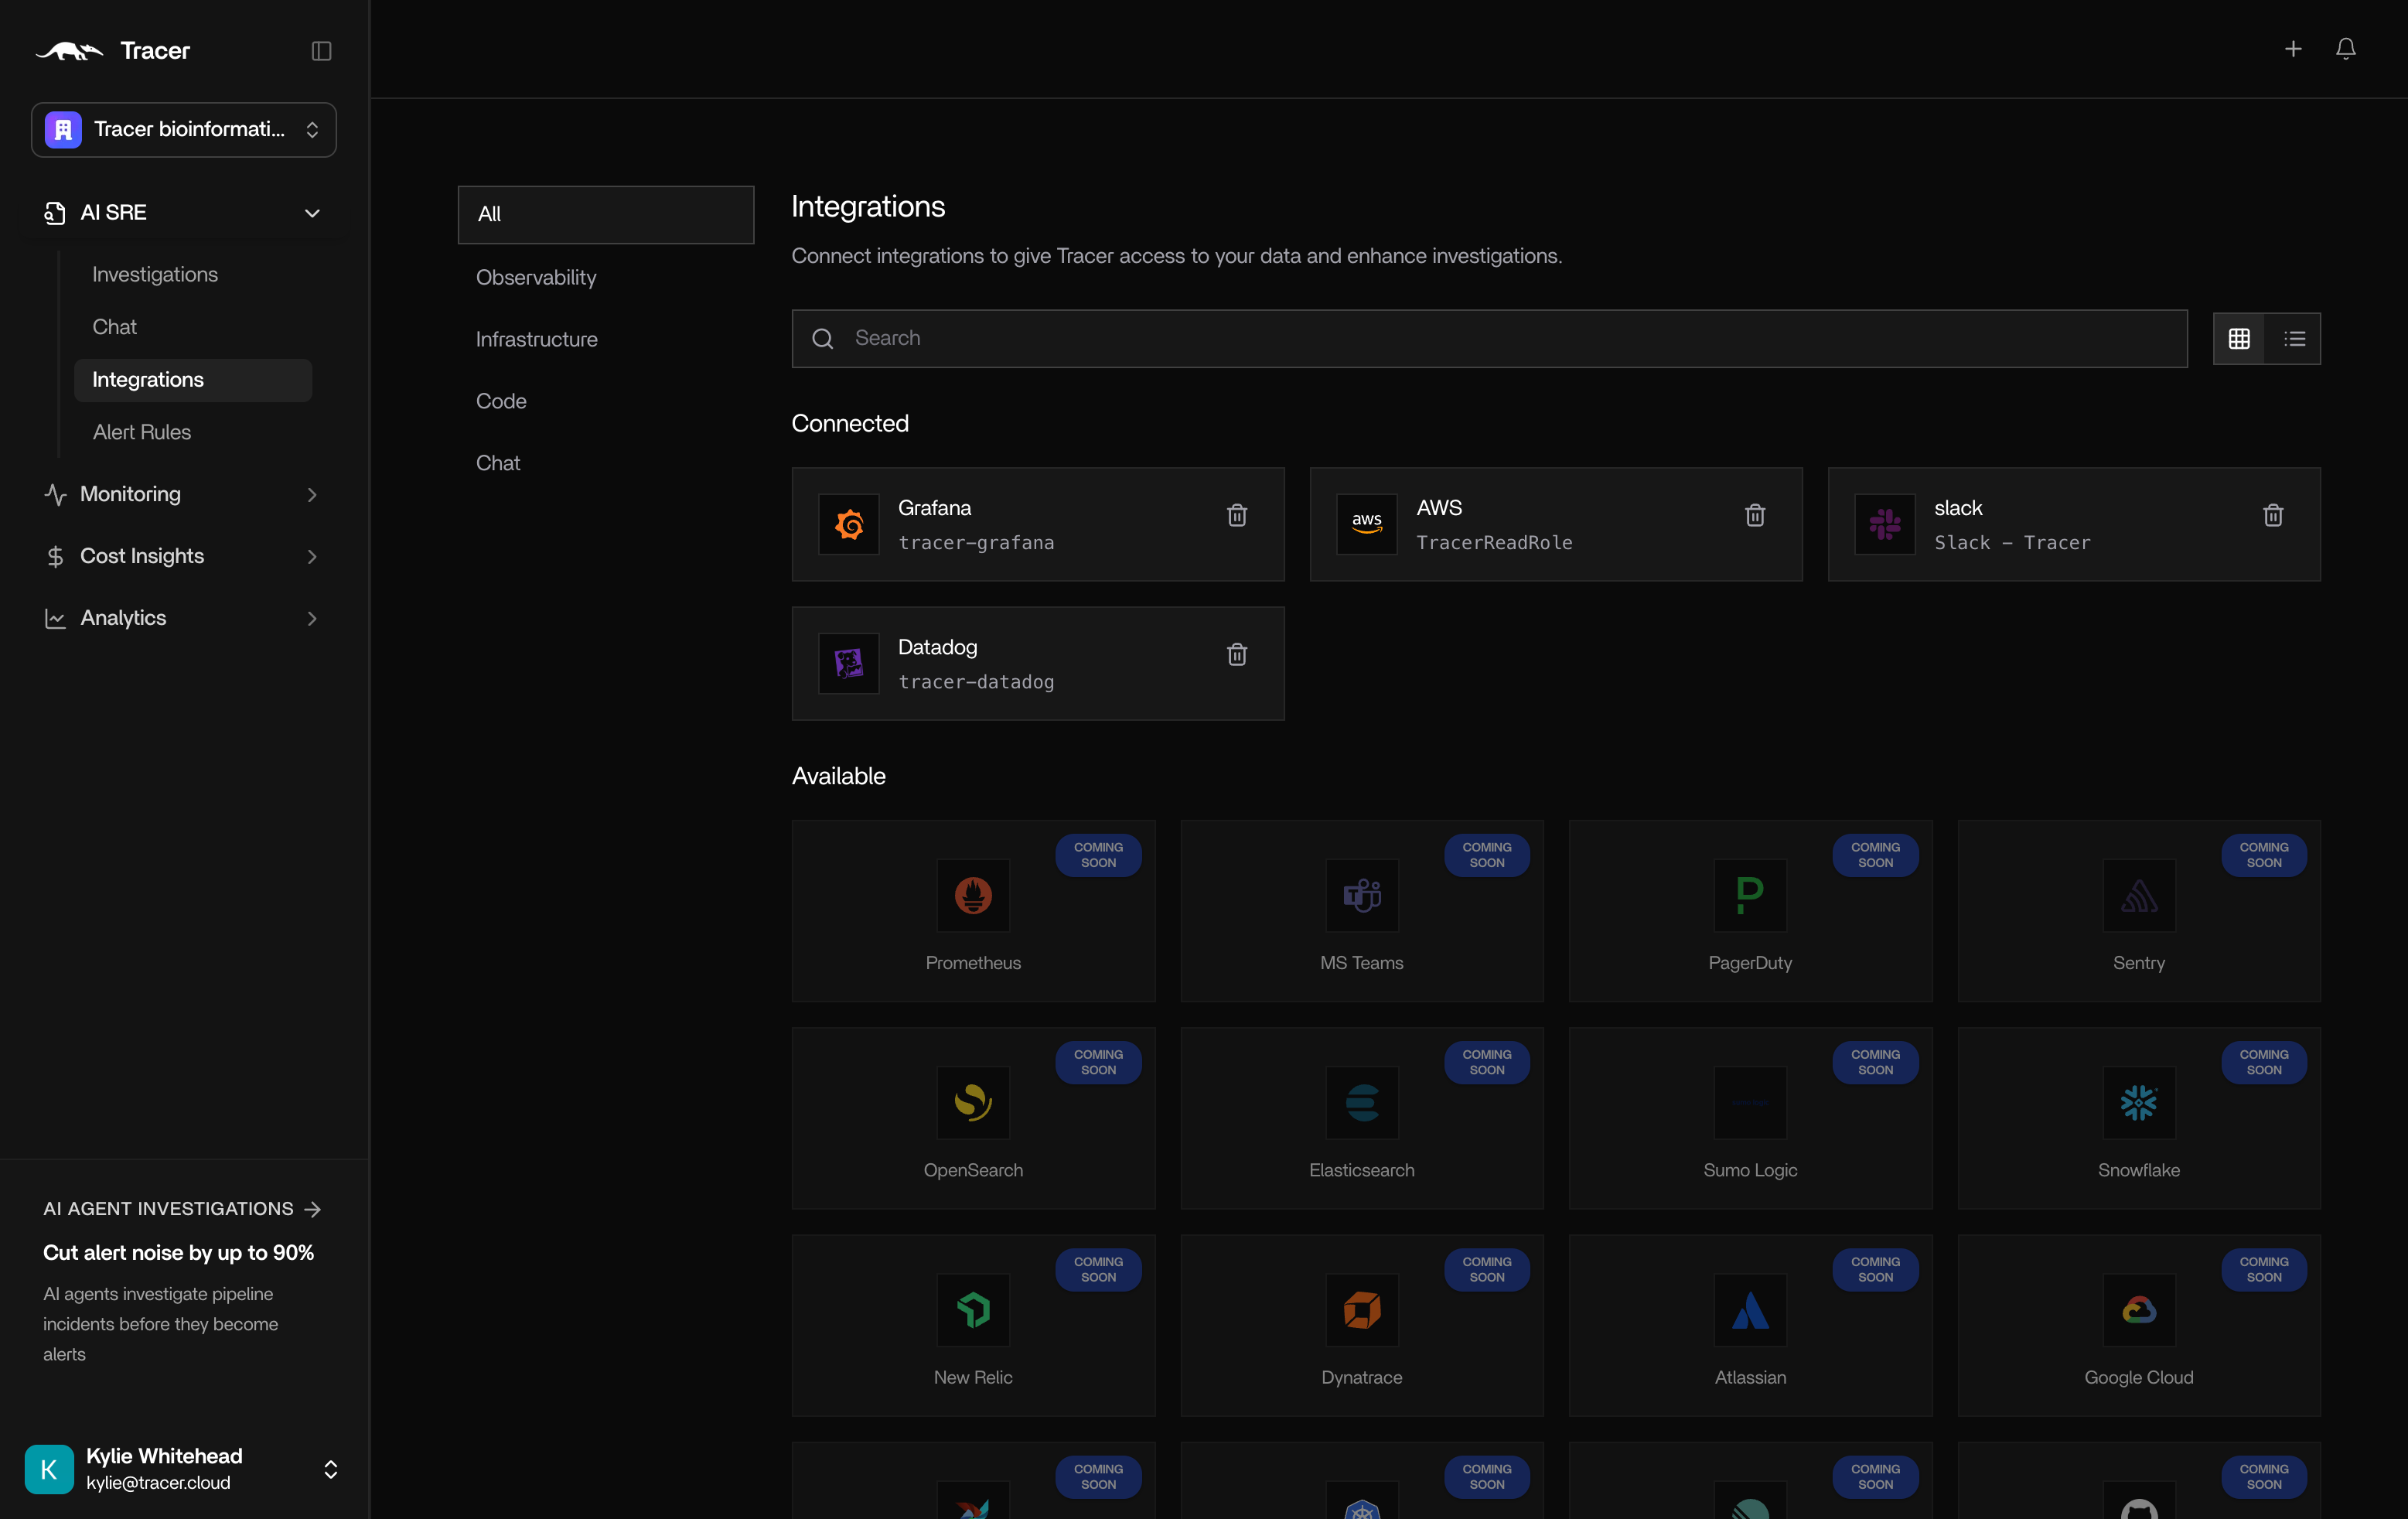
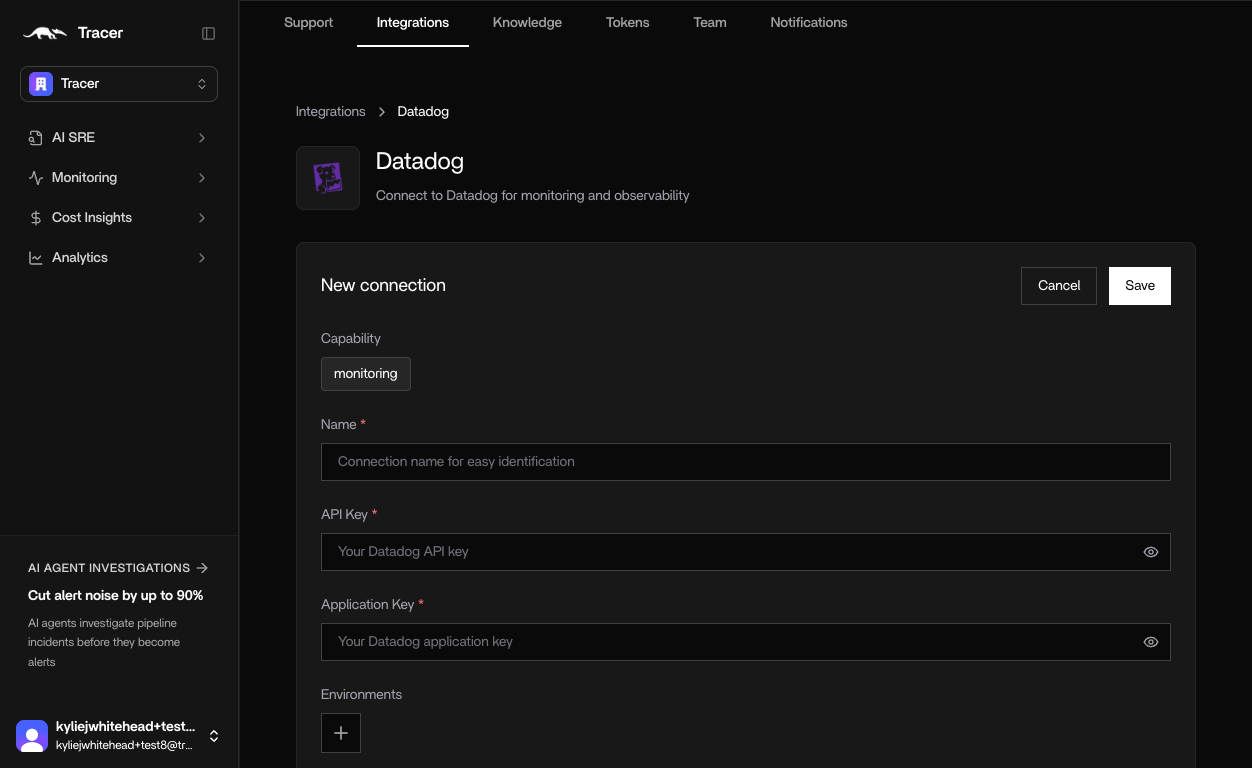
Example: Datadog in the web app
- Name — distinguish between instances (for example
prodvsstaging) - API key — create in Datadog and paste into OpenSRE
- Application key — create in Datadog and paste into OpenSRE