


An agentic SRE that answers production questions autonomously — so your on-call rotation doesn’t have to start cold.
Point it at the tools your team already uses — Datadog, Grafana, Slack, PagerDuty, and 60+ others. It pulls the logs and metrics that matter, figures out what happened, and answers in plain English.
Get started
Install OpenSRE
One command on macOS or Linux, then run
opensre to get started.Create your account
Run
opensre to sign in and activate the hosted model.Connect your tools
Datadog, Grafana, PagerDuty, Slack, Kubernetes, and more.
Open the shell
Paste in an alert, or just describe what’s going on.
What is OpenSRE?
OpenSRE is an open-source agent that answers production questions for you. When an alert comes in — or you just tell it something’s wrong — it goes and checks: recent deploys, logs, metrics, whatever’s connected. Then it tells you what it found. Who’s it for? Anyone on call who’s tired of starting from a blank tab at 3am. It’s built for engineers who want a head start on the cause, not a black box that hides how it got there. Why people like it:- It works with what you already have — no need to rip out your existing stack
- You can run it locally, in your terminal, or hook it into a hosted setup for your whole team
- It’s open source, so you can see exactly what it’s doing and change it if you need to
What you can do with it
Chat with it
Describe an incident in plain language, or use commands like
/health and /verify.Set a goal
Give it a finish line and let it keep working across turns until it gets there.
Connect 60+ tools
Monitoring, incident management, cloud, code, chat, databases — most of what you already run.
Keep sensitive data out
Secrets and personal data get redacted before anything leaves your environment.
Try it now
1
Install
One command and you’re done — no dependencies to wrangle first.
2
Get started
Run
opensre to sign in and start the shell. Create an account or sign in using email or another enabled provider; OpenSRE then activates the hosted model. Describe what’s going on in your own words — or paste the alert body straight in. Add tools later with opensre integrations setup <service> when you want it to query GitHub, Datadog, Grafana, Slack, or another system.How a turn runs
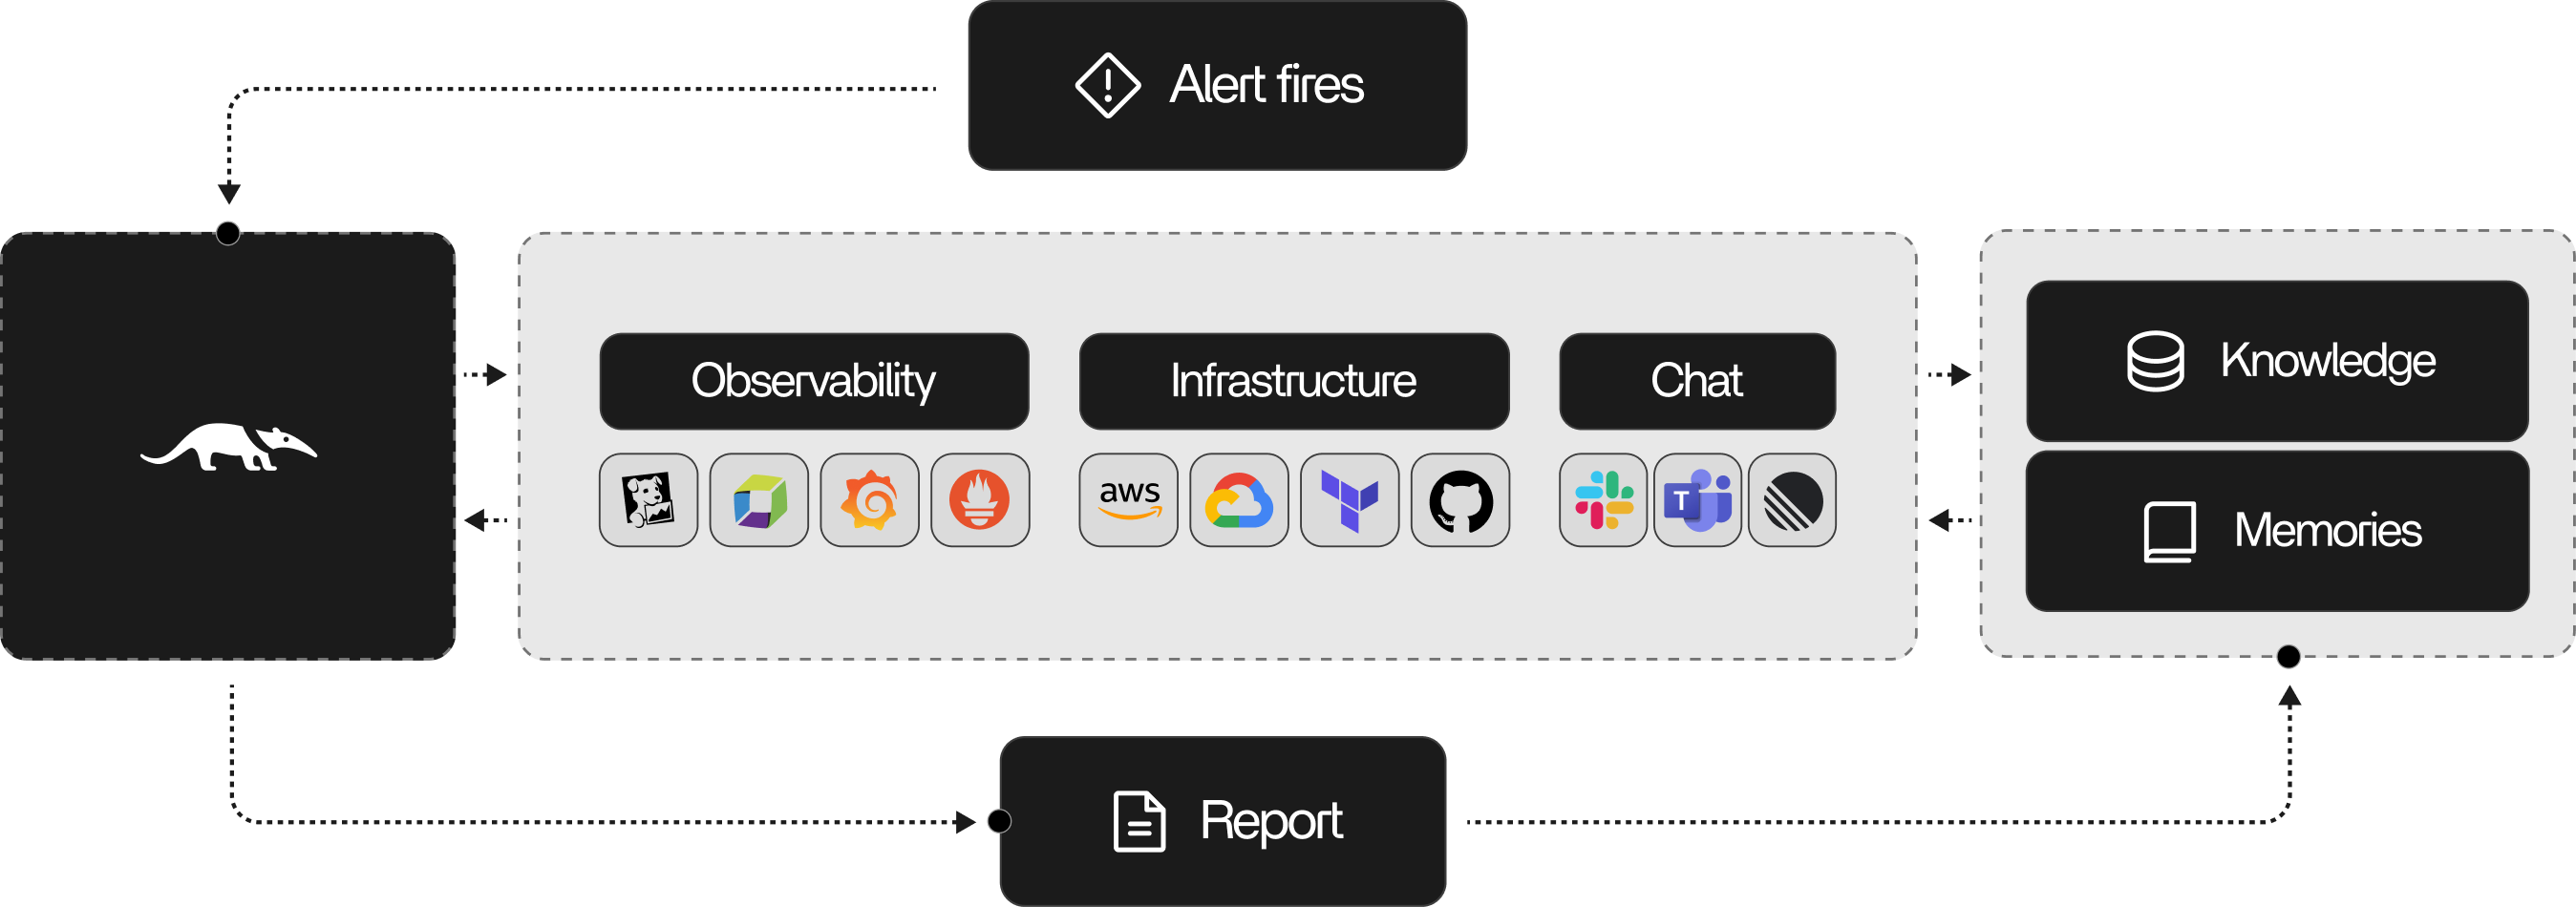
Say an alert fires and you paste it in. Here’s roughly what happens next:- OpenSRE reads the alert and figures out what kind of problem it’s looking at
- It gathers context — who owns the service, what changed recently, what’s normal
- It goes and checks the tools you’ve connected for logs, metrics, and traces
- It keeps digging and testing ideas until it can answer
- It answers in the shell, and sends the result wherever you asked — Slack, Telegram, a file
Agent workflow
Keep exploring
Showcase
See real output from sample runs.
Features
A rundown of everything OpenSRE can do today.
Shell command
Every slash command the interactive shell understands.
FAQ
Quick answers to common setup and usage questions.