

Overview
OpenSRE queries Datadog when you ask about an incident — logs, metrics, monitor state, and events correlated with it.Prerequisites
- Datadog account with API access
- API key (organization settings)
- Application key with read scopes (
events_read,logs_read_data,logs_read_index_data,monitors_read)
Setup
Option 1: Interactive CLI
datadoghq.com or datadoghq.eu).
Option 2: Environment variables
Add to your.env:
For multiple Datadog orgs or sites, use multi-instance with
DD_INSTANCES (not DATADOG_INSTANCES).
Option 3: Persistent store
Option 4: Hosted web app (OpenSRE Cloud)
Hosted OpenSRE Cloud is coming soon. Until then, use the local CLI, environment variables, or persistent store above.
- In app.tracer.cloud, go to Integrations → Datadog
- Enter a name, and paste your API and application keys
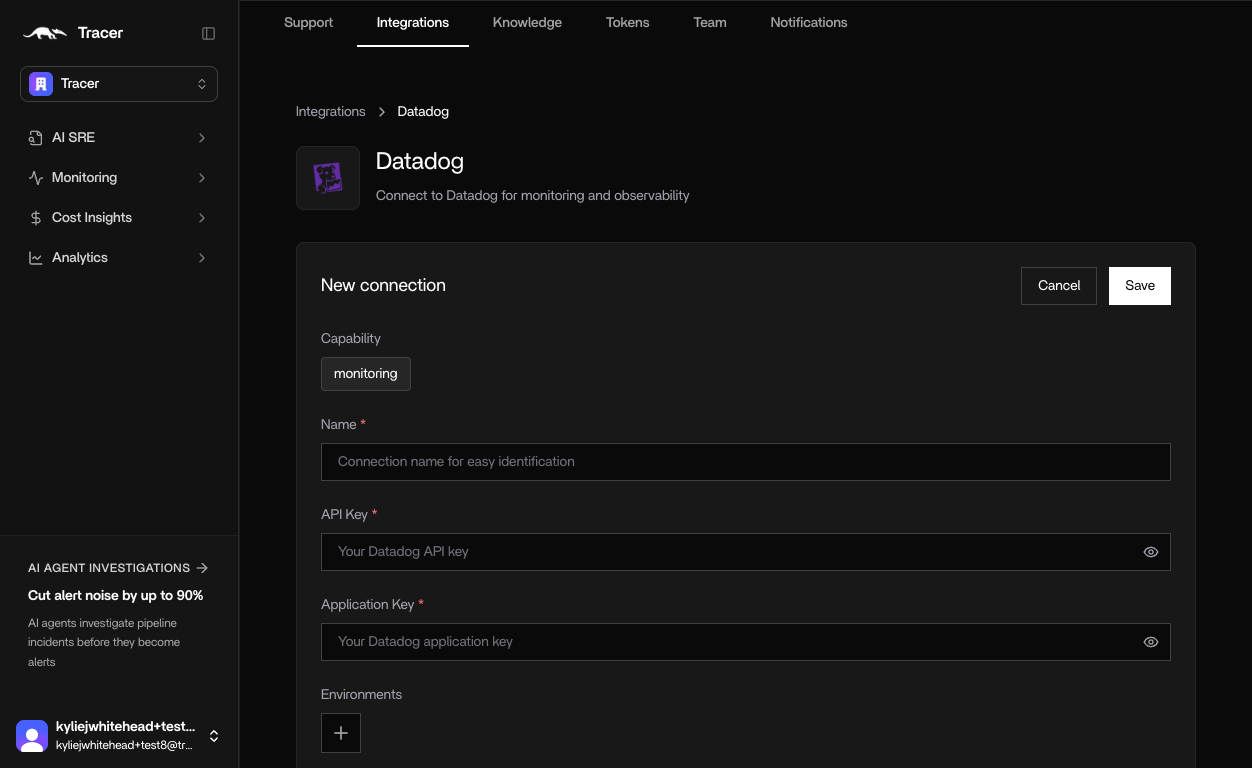
Credentials
API key
- In Datadog, go to Organization Settings → API Keys (direct link)
- Click + New Key and name it (for example
opensre) - Copy the key
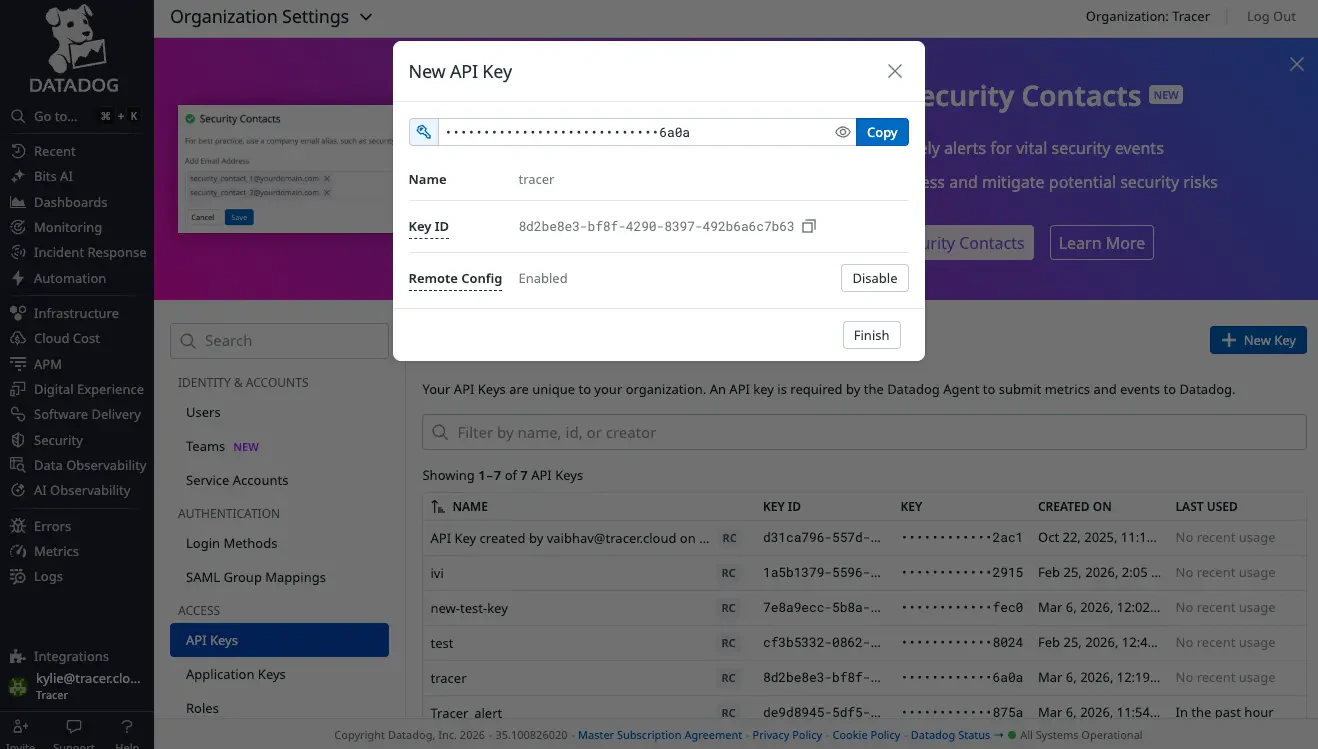
Application key
- Go to User Settings → Application Keys (direct link)
- Click + New Key and name it (for example
opensre) - Under Edit Scope, enable at minimum:
events_read,logs_read_data,logs_read_index_data,monitors_read - Under Actions API Access, click Enable
- Copy the key
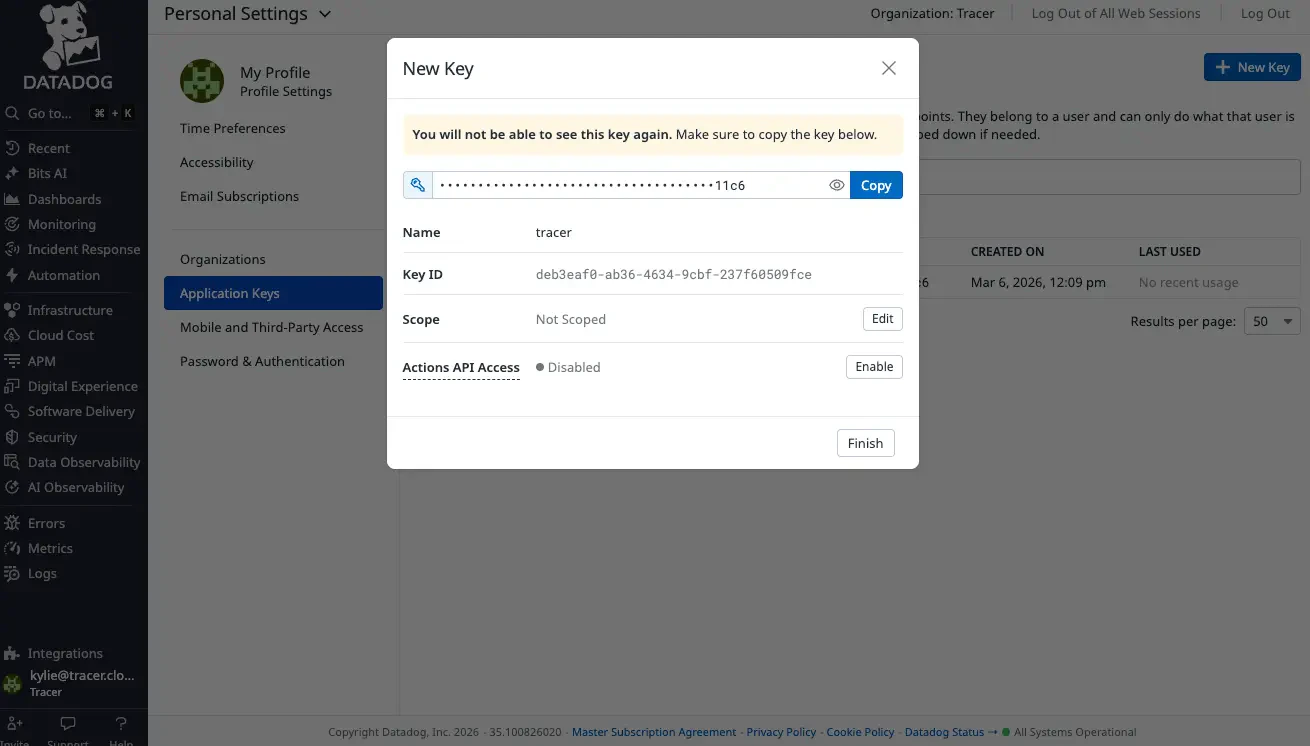
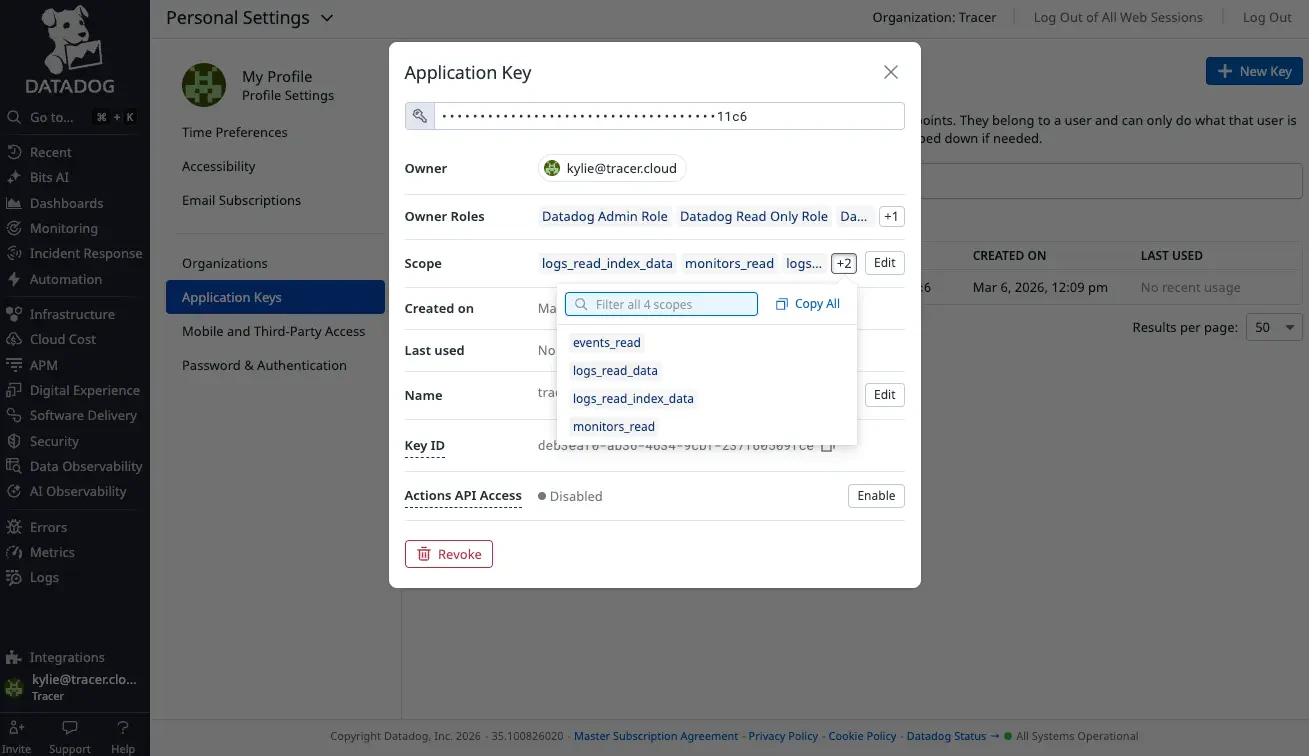
Some Datadog UI labels may still show an older product name. Any key name works — use
opensre for clarity.Tools
Verify
/integrations verify datadog or /verify datadog.
Troubleshooting
Security
- Create a dedicated application key with read-only scopes.
- Store keys in
.envor your secret manager — not in source control.