

Overview
OpenSRE queries Grafana (Cloud or self-hosted) for logs, metrics, traces, alert rules, and annotations. For a local Minikube lab with Prometheus and a sample app, see Extras.Prerequisites
- Grafana instance URL (Cloud stack URL or self-hosted origin)
- Service account token with read access — see Credentials
Setup
Option 1: Interactive CLI
Option 2: Environment variables
For prod/staging pairs, use
GRAFANA_INSTANCES — see Multi-instance integrations.
Option 3: Persistent store
Option 4: Hosted web app (OpenSRE Cloud)
Hosted OpenSRE Cloud is coming soon. Until then, use the local CLI, environment variables, or persistent store above.
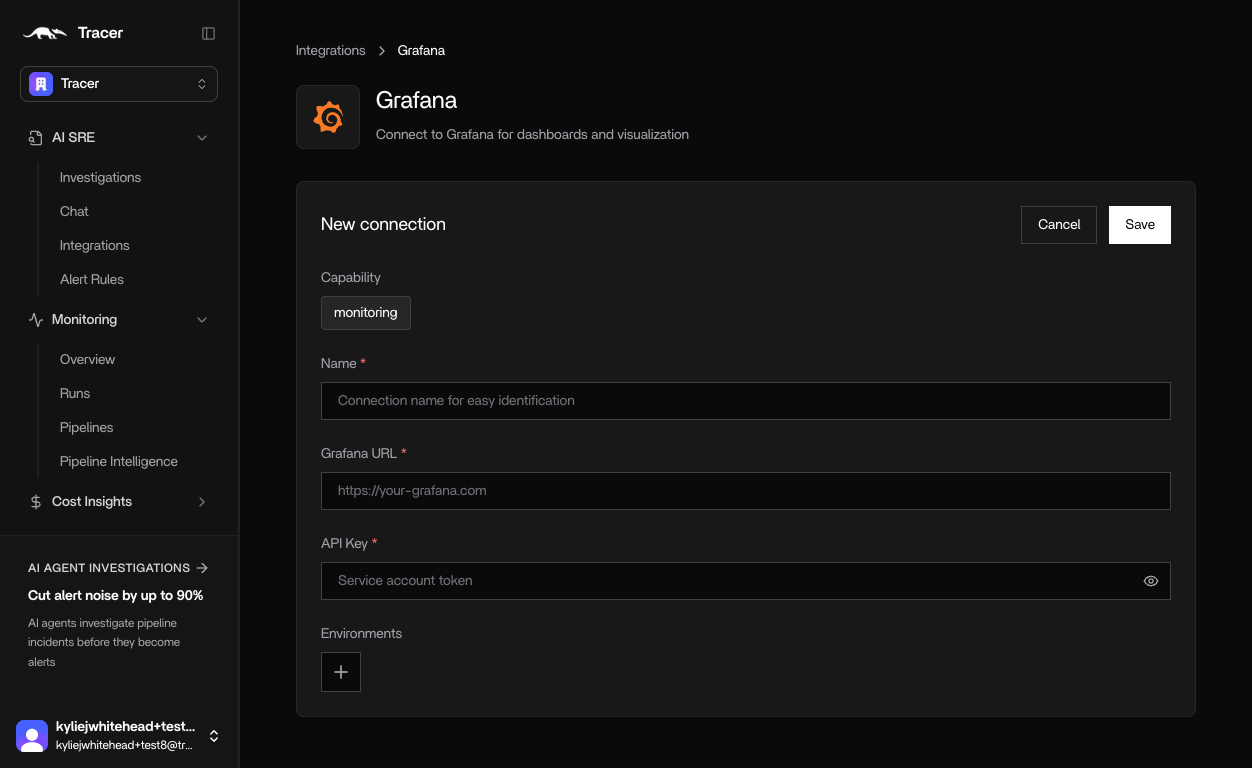
- In app.tracer.cloud, go to Integrations → Grafana
- Enter a name, instance URL, and service account token
- Click Save
Self-signed or internal CA certificates
If Grafana uses a certificate signed by an internal CA,opensre integrations setup grafana prompts for:
You can also set these in
.env:
Credentials
Create a Grafana service account token with read access. See Grafana service account tokens.- In Grafana, open Administration → Service accounts (or your stack’s equivalent).
- Create a service account with read access to the datasources you want OpenSRE to query.
- Add a token to that service account and copy it (shown once).
GRAFANA_READ_TOKEN (CLI prompt: service account token).
Tools
Deployment and config-change markers are covered on Grafana Annotations. For standalone Tempo (no Grafana proxy), see Grafana Tempo.
Verify
Troubleshooting
Security
- Prefer a dedicated service account token with read-only access.
- Prefer
GRAFANA_CA_BUNDLEover disabling TLS verification for real internal Grafana. - Set
GRAFANA_VERIFY_SSL=falseonly for local/lab instances. - Store tokens in
.envor your secret manager — not in source control.
Extras
Local Grafana setup (Minikube example)
Use this lab to run Grafana, Prometheus, and a sample app locally, then connect OpenSRE.Steps
-
Start Minikube:
-
Add Helm repositories and update:
-
Install the kube-prometheus stack:
-
Install the podinfo sample app:
-
(Optional) Check pods:
-
Port-forward podinfo (separate terminal):
-
Port-forward Prometheus (separate terminal):
-
Port-forward Grafana on all interfaces (separate terminal):
-
Allow Prometheus to scrape podinfo ServiceMonitors:
Grafana credentials
Get the admin password:admin; password is the command output.
Access
Simulate load
Sample Grafana queries
Request rate by status: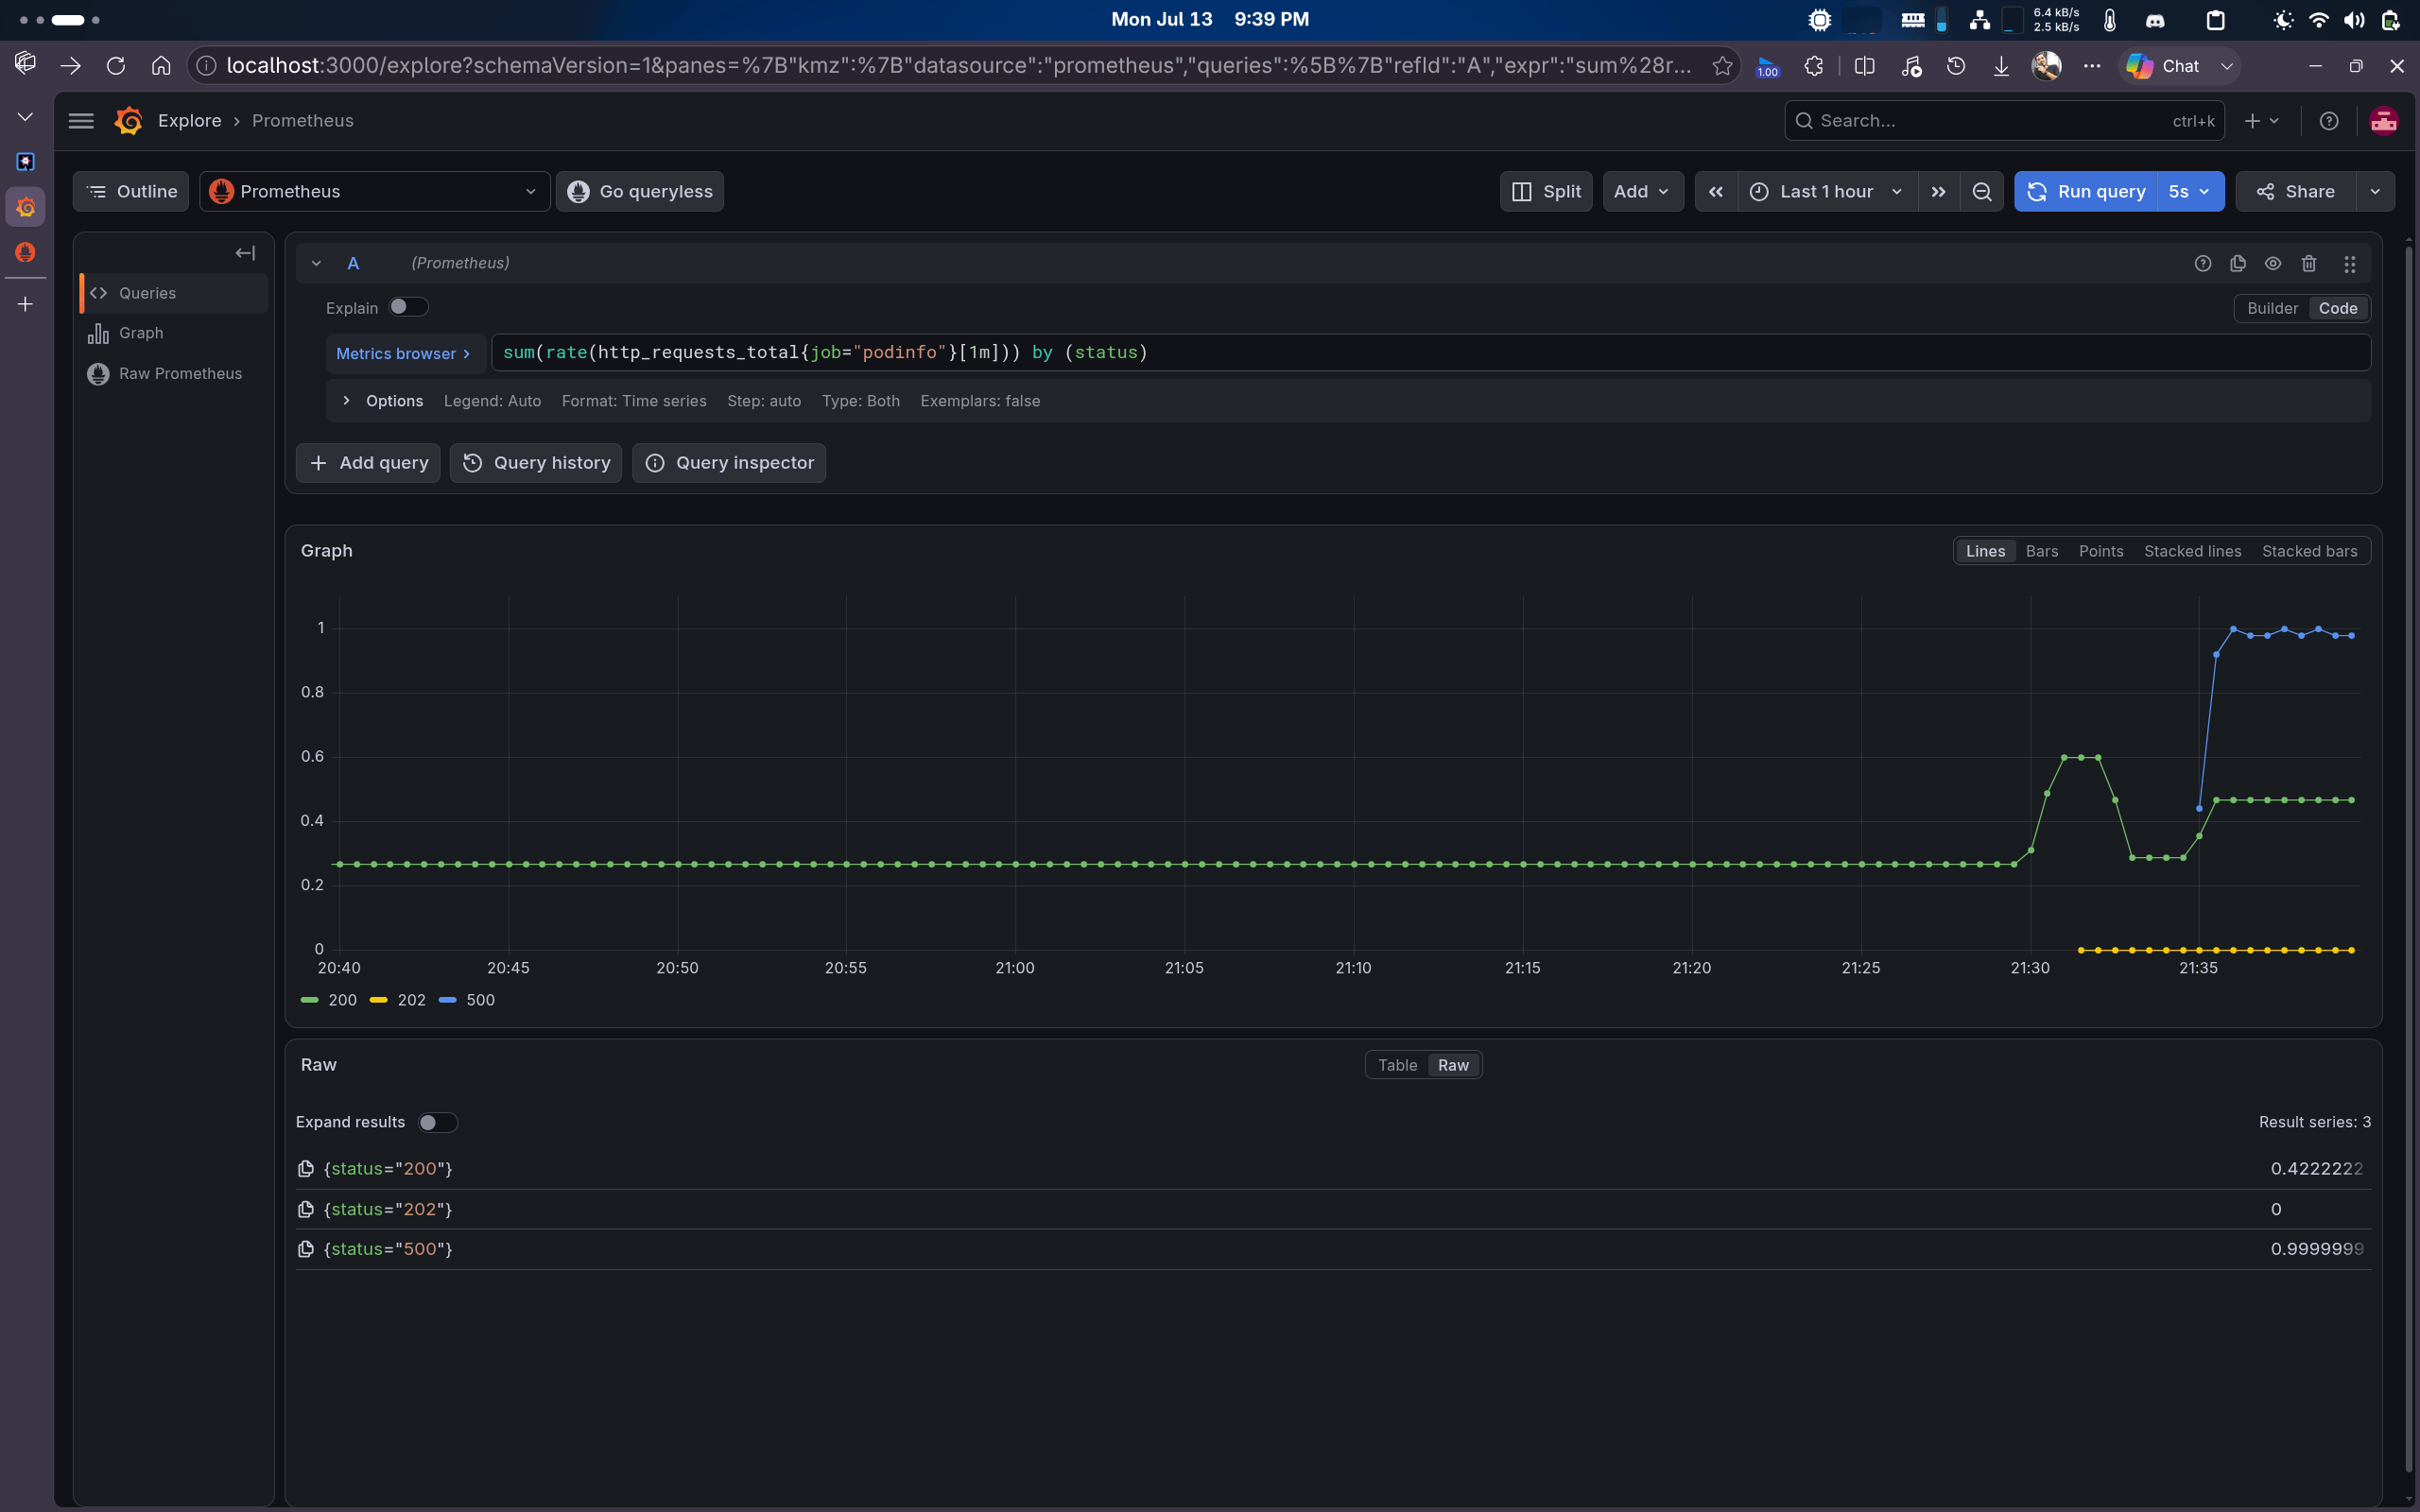
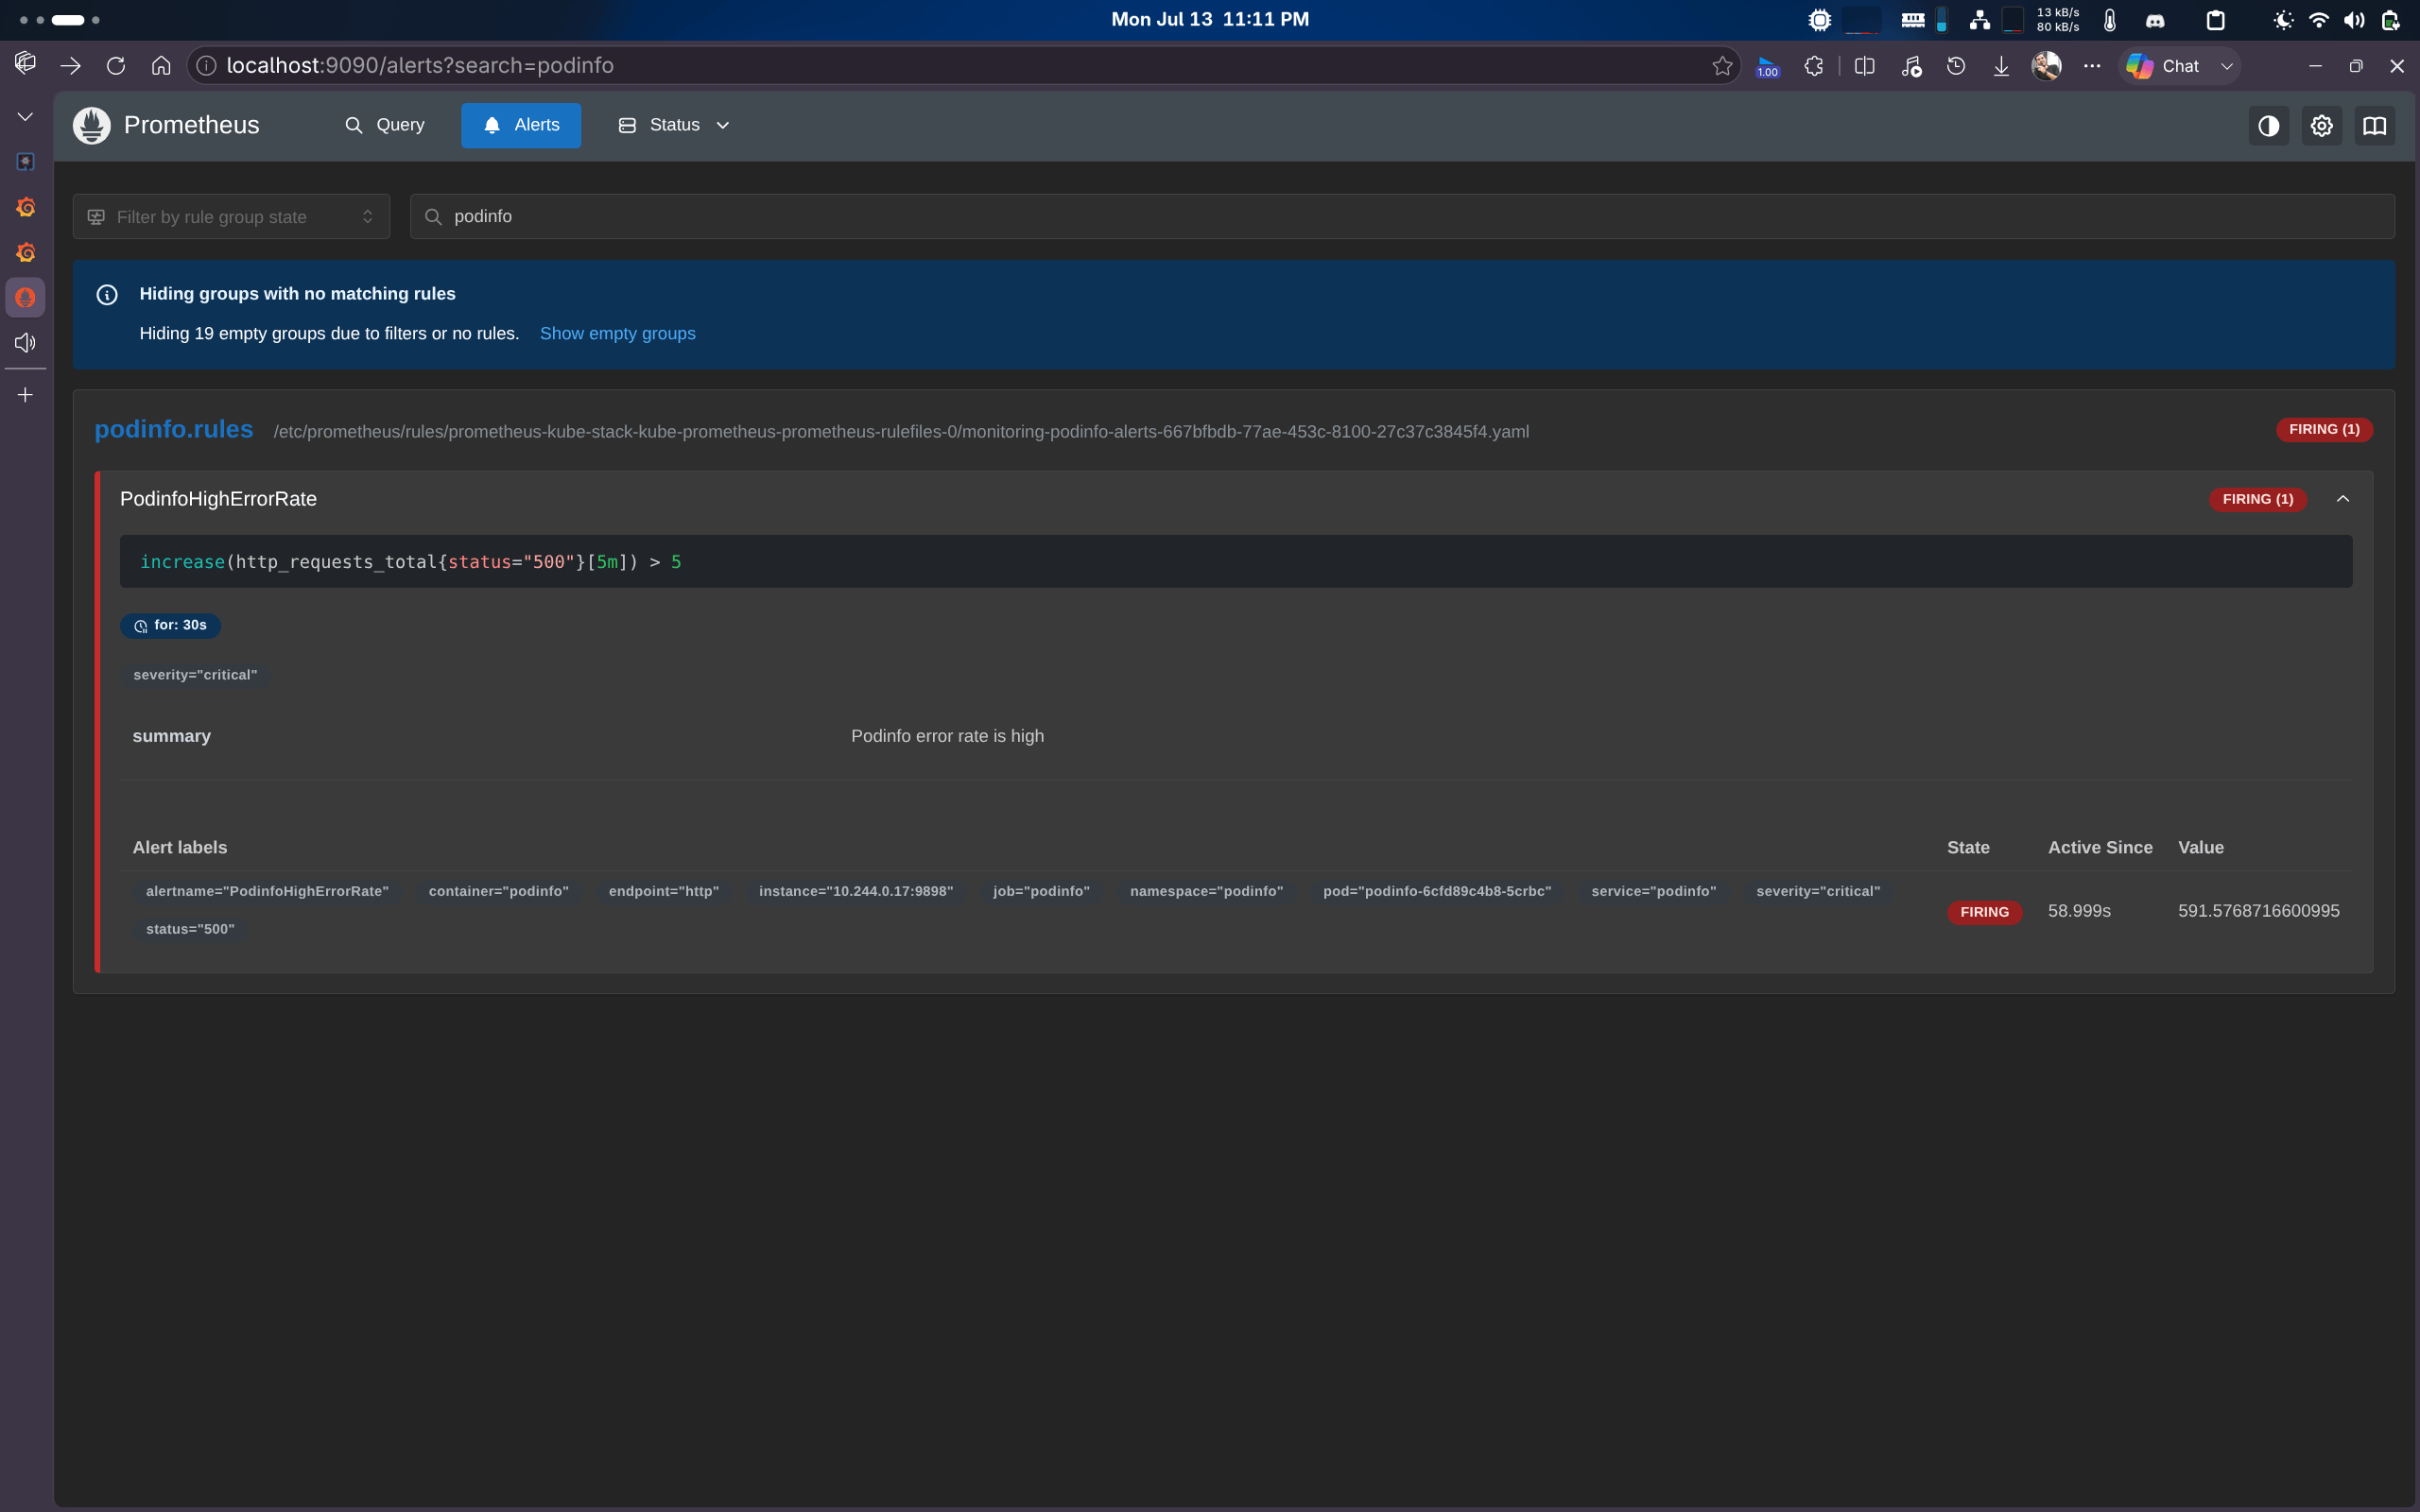
Prometheus alert for high error rate
Connect OpenSRE to the lab Grafana
-
Get your machine’s LAN IP:
- Create a Grafana service account token (Grafana docs).
-
Run setup and enter:
For local/lab TLS issues, set
GRAFANA_VERIFY_SSL=falseor answer the SSL prompts as described in Setup.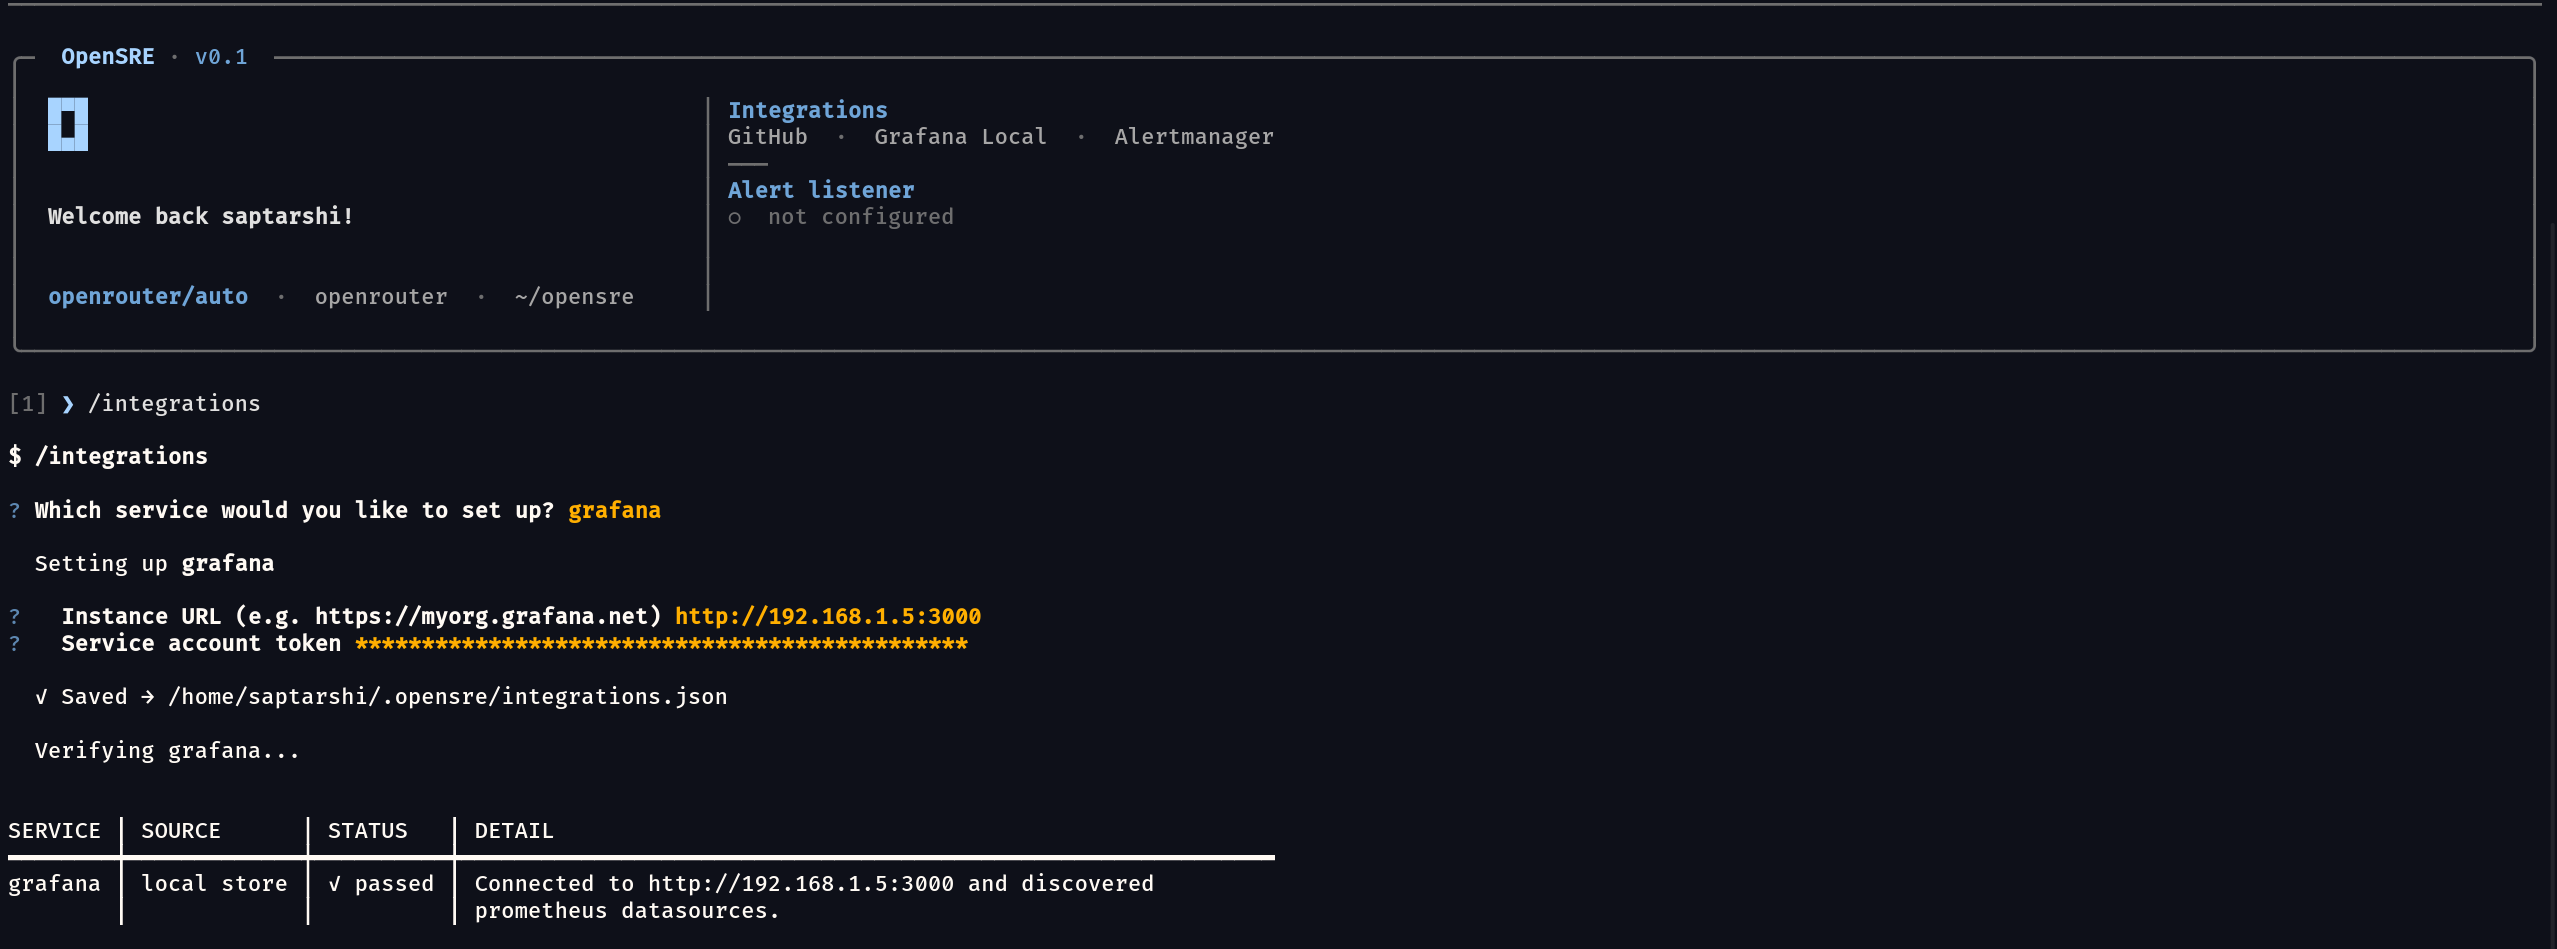
Add Loki and Tempo for full tool coverage
The steps above give OpenSRE working metrics querying and (once a rule/annotation exists) alert-rule and annotation querying, but log search, service-name discovery, and trace querying need Loki and Tempo datasources, which this lab doesn’t install by default. Verified live: without them, those three capabilities return"Loki datasource not found" / "Tempo datasource not found", not real data.
-
Add the Grafana chart repo and install Loki (bundled with Promtail) and Tempo:
-
Register both as Grafana datasources (the chart doesn’t auto-provision them):
-
Add a
service_namerelabel to Promtail (derived from the pod’sapp.kubernetes.io/namelabel) by upgrading the release with an extra relabel config alongside Promtail’s defaults: -
Enable request tracing on podinfo — it ships an OpenTelemetry exporter but keeps
it disabled until both
--otel-service-nameand an OTLP endpoint are set (the chart’sextraEnvsalone is not enough; confirmed viapodinfo --help, which states tracing is disabled unless--otel-service-nameis set):The upgrade replaces the podinfo pod, so re-run the port-forward from Steps (step 6) if it’s still attached to the old pod. -
Add the same
service_namerelabel to the podinfo ServiceMonitor for metrics (kubectl patchhere, since the podinfo chart doesn’t exposemetricRelabelingsas a values key): -
Generate some traffic so there’s real data for every tool, then confirm each
datasource actually has it:
Ask the agent
opensre and ask about the failing app from Steps, e.g.
Why is podinfo’s error rate high? Check Grafana logs, metrics, and traces.
All 6 registered tools return real data against this lab once the datasources and
relabelings above are in place — confirmed by direct calls to each tool: metrics
querying (real http_requests_total series, service_name="podinfo"), log search (real
podinfo log lines), trace querying (real spans like GET /status/{code:[0-9]+} from the
generated load), service-name discovery (["podinfo", ...]), alert-rule querying (the
rule created via /api/v1/provisioning/alert-rules below), and annotation querying (an
annotation created via /api/annotations).
Alert-rule and annotation querying use Grafana’s own
alerting/annotation APIs, not the raw
PrometheusRule CRD from
Prometheus alert for high error rate — that
CRD is evaluated by Prometheus itself and never becomes a Grafana-managed rule.
To exercise these two tools with real data, create a rule and annotation through
Grafana directly, for example:Teardown
Ctrl-C each one
first (deleting the cluster also kills them, but not always cleanly on every platform).