opensre binary.
You can work in two ways:
- Interactive prompt shell — run
opensrewith no subcommand (TTY) to enter the REPL: describe incidents conversationally, stream investigations, and use slash commands. - Direct investigation — run
opensre investigatefrom your terminal with-ipointing at an alert payload (or--interactiveto pick a file in the UI). The process runs and exits when the investigation completes.
1) Start an investigation
Interactive shell (opensre)
From a terminal with stdin and stdout attached (opensre detects a TTY), run:
/help for slash commands and /exit when finished. See Interactive Shell Commands for the full slash-command reference (/cost, /status, /investigate, and every other REPL command).
When LLM_PROVIDER is openai or codex, /effort sets how much reasoning the model applies for that REPL session (low, medium, high, xhigh, or max). Run /effort with no arguments to print the current level and usage; /status includes the same field. Other providers ignore this setting (the shell prints a hint). You can also set OPENSRE_REASONING_EFFORT to low, medium, high, or xhigh in the environment for non-interactive defaults.
Plain language and compound requests
You do not need to memorize every slash command. Describe what you want in natural language and the REPL planner maps intent to the right actions — often a sequence of slash commands executed in order. Examples:| You type | Typical action |
|---|---|
| ”check the health of my opensre and then show connected services” | /health, then /integrations list |
| ”verify datadog” | /integrations verify datadog |
| ”run the sample alert investigation” | /investigate with a built-in template |
| ”connect to my remote EC2 instance and send it hello world” | /remote subcommands, then a remote investigation |
/list):
| Intent | Command |
|---|---|
| Connected integrations | /integrations list |
| Investigation tools | /tools |
| Background tasks | /tasks |
| MCP servers | /mcp list |
| Cron deliveries | /cron list |
| Past REPL sessions | /sessions |
Direct investigation (opensre investigate)
Pass an alert payload to opensre investigate:
--interactive to pick an input file from your terminal UI.
For deployed services by name, see Remote runtime investigation.
2) Review investigation artifacts
A local run produces structured RCA artifacts such as:problem.mdfor incident framing and initial hypothesistheory/hypothesis_*.mdfor each hypothesis tested during the runreport.mdfor final root-cause summary and next steps
3) Understand what OpenSRE analyzed
Each run captures:- the original alert payload
- extracted context and normalized evidence
- tool outputs collected from connected integrations
- final diagnosis and recommended remediation steps
Session continuity
REPL sessions are persisted under~/.opensre/sessions/. When you exit, the shell prints a /resume <session-id> hint so you can pick up later. See Session history.
Chat
For local binary usage, the primary workflow is file-based (problem.md, report.md, and optional JSON output).
You can open these artifacts in your editor and iterate from there (for example, by asking your editor’s AI chat
to drill into specific hypotheses or evidence sections).
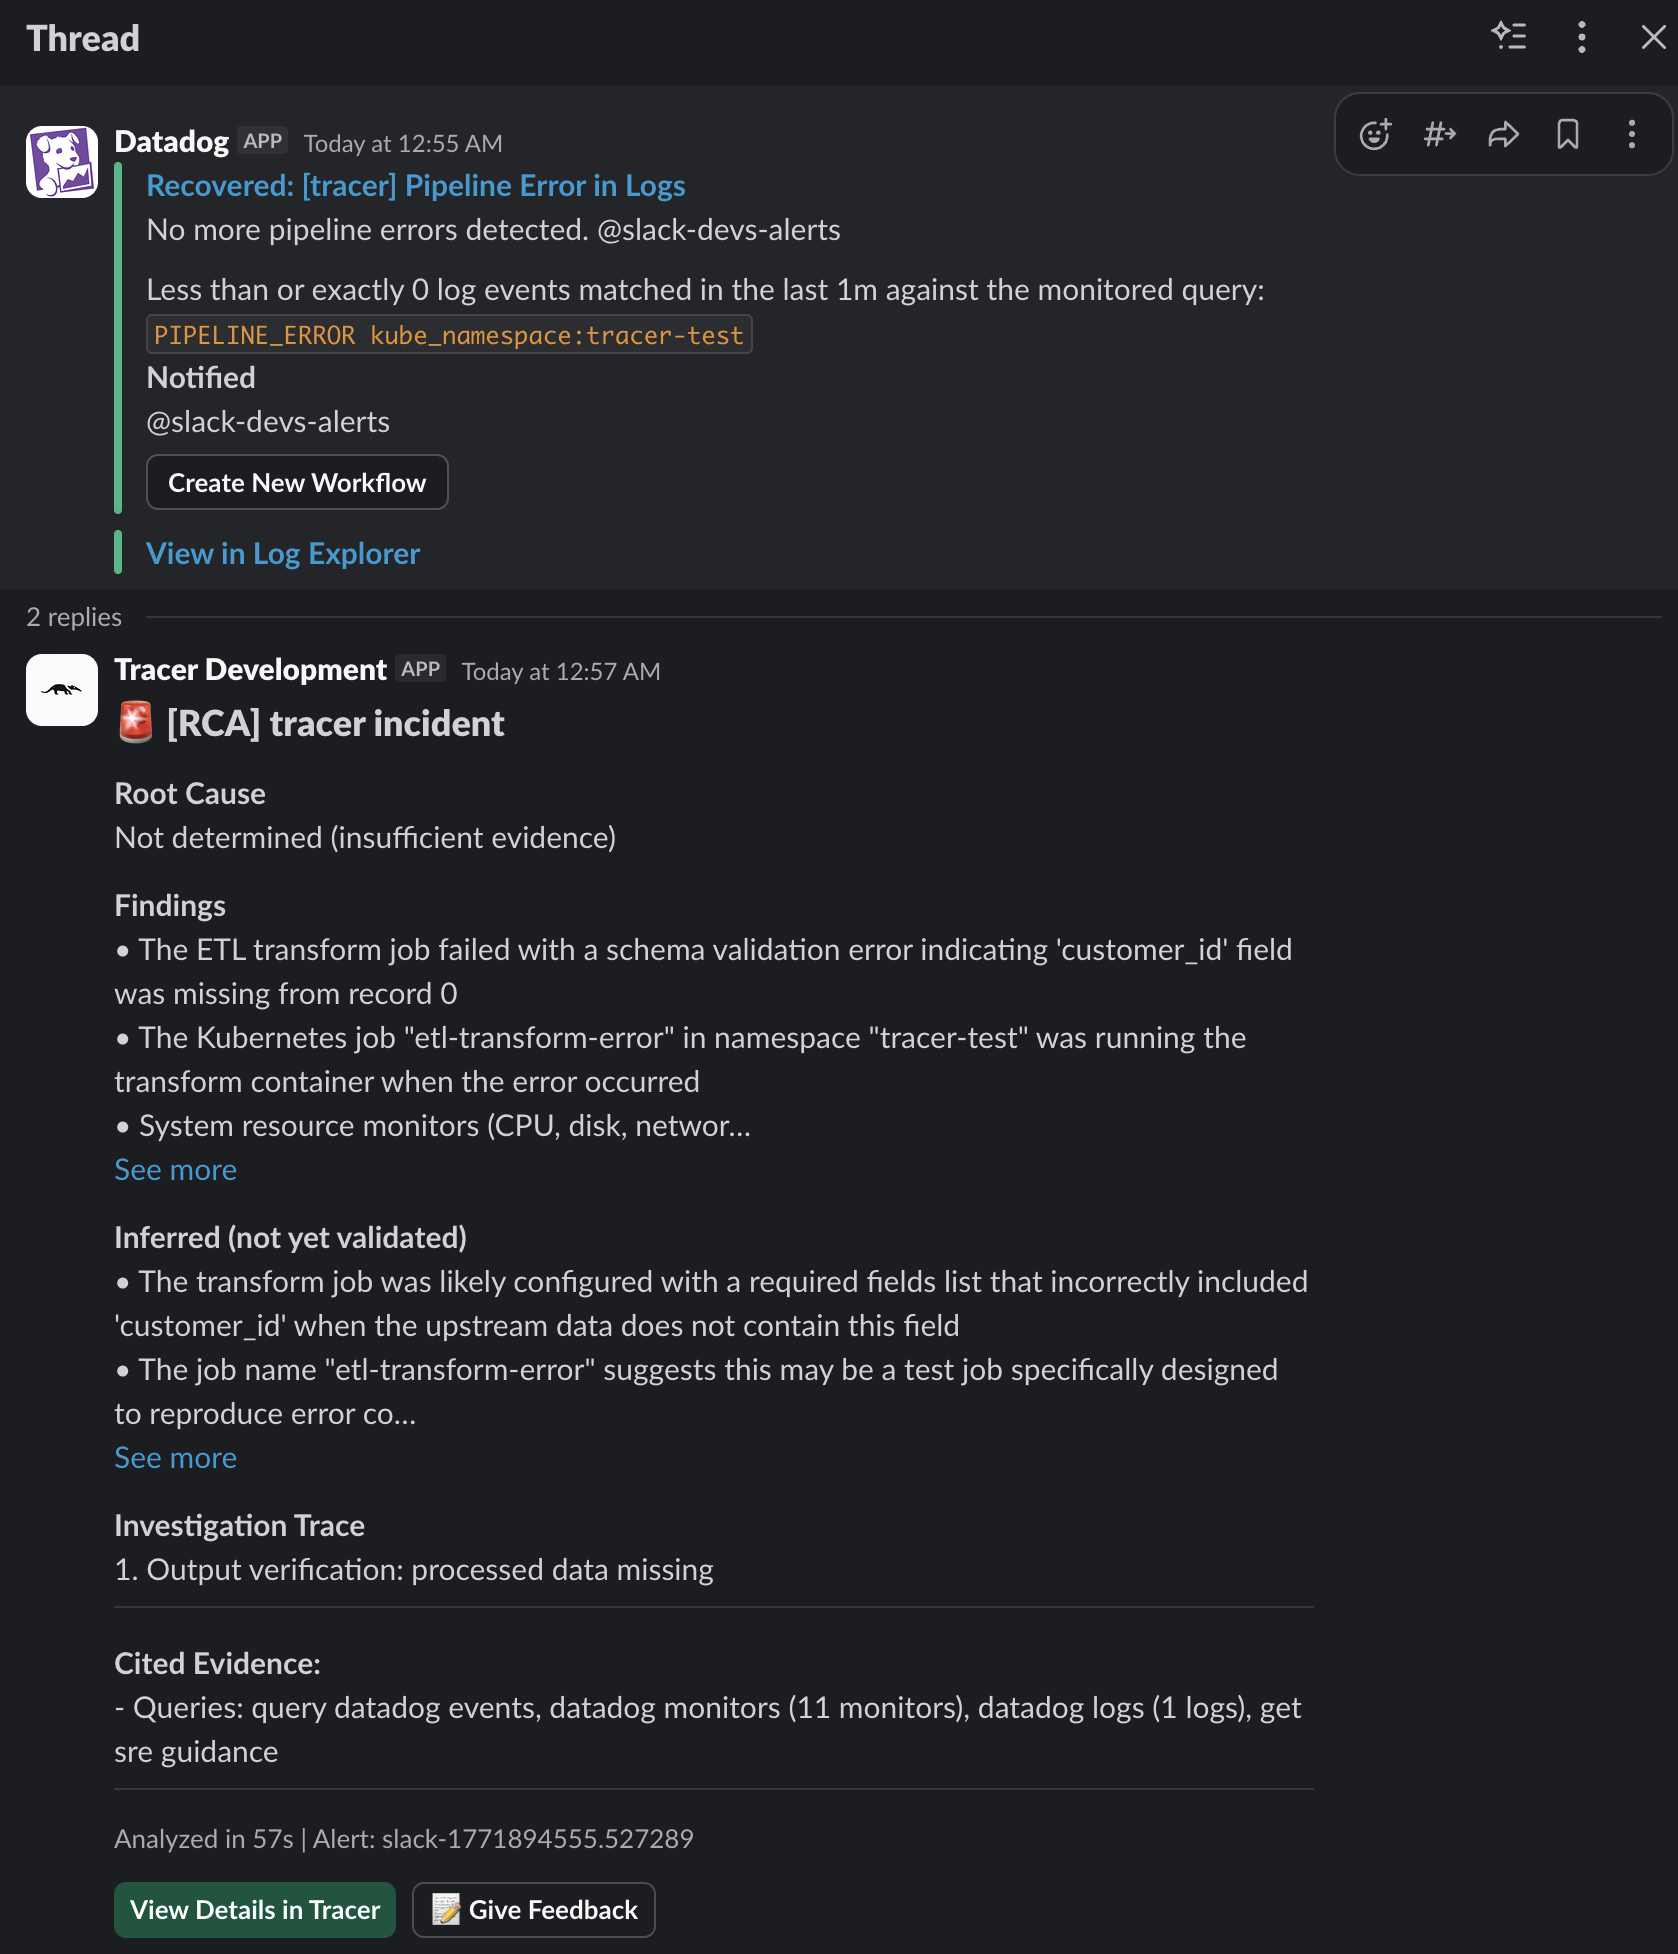
Slack reports
If you’ve configured the Slack integration, OpenSRE can publish a concise incident summary into Slack after the local investigation completes.