> ## Documentation Index
> Fetch the complete documentation index at: https://opensre.com/docs/llms.txt
> Use this file to discover all available pages before exploring further.
# OpenSRE
OpenSRE is agentic alert investigation for production systems. It connects to your observability stack, infrastructure, and knowledge bases to investigate incidents before your team gets paged — then delivers root-cause analysis and recommended fixes to Slack, PagerDuty, or local files.
Tracer to OpenSRE
Coming from Tracer? Welcome. OpenSRE is the open-source home for these docs, while some live URLs, installers, assets, and Slack app labels still use the Tracer name during the transition.
## Get started
Install OpenSRE and run your first alert investigation.
Wire OpenSRE into observability, incident, code, and data systems.
See how OpenSRE gathers evidence and produces root cause analysis.
## First 5 minutes
```bash theme={null}
# Install (macOS / Linux)
curl -fsSL https://install.opensre.com | bash
# Configure LLM + integrations
opensre onboard
# Run a sample investigation
opensre investigate -i tests/e2e/kubernetes/fixtures/datadog_k8s_alert.json
```
After the run completes, open the generated artifacts:
* `problem.md` — incident framing
* `theory/hypothesis_*.md` — hypotheses tested during the run
* `report.md` — root cause, confidence, and next steps
Or export JSON for automation:
```bash theme={null}
opensre investigate -i --output ./rca.json
```
**Interactive shell** — run `opensre` with no subcommand to describe incidents in plain language and use slash commands (`/help`, `/verify datadog`, `/investigate`).
Stuck? See [Quickstart troubleshooting](/docs/quickstart#troubleshooting) (Docker running, `make` installed, LLM configured).
## Start here
Alert ingestion, evidence collection, masking, and remote runtime workflows.
Sample outputs, quickstart demos, and CloudOpsBench benchmark walkthrough.
## How it works
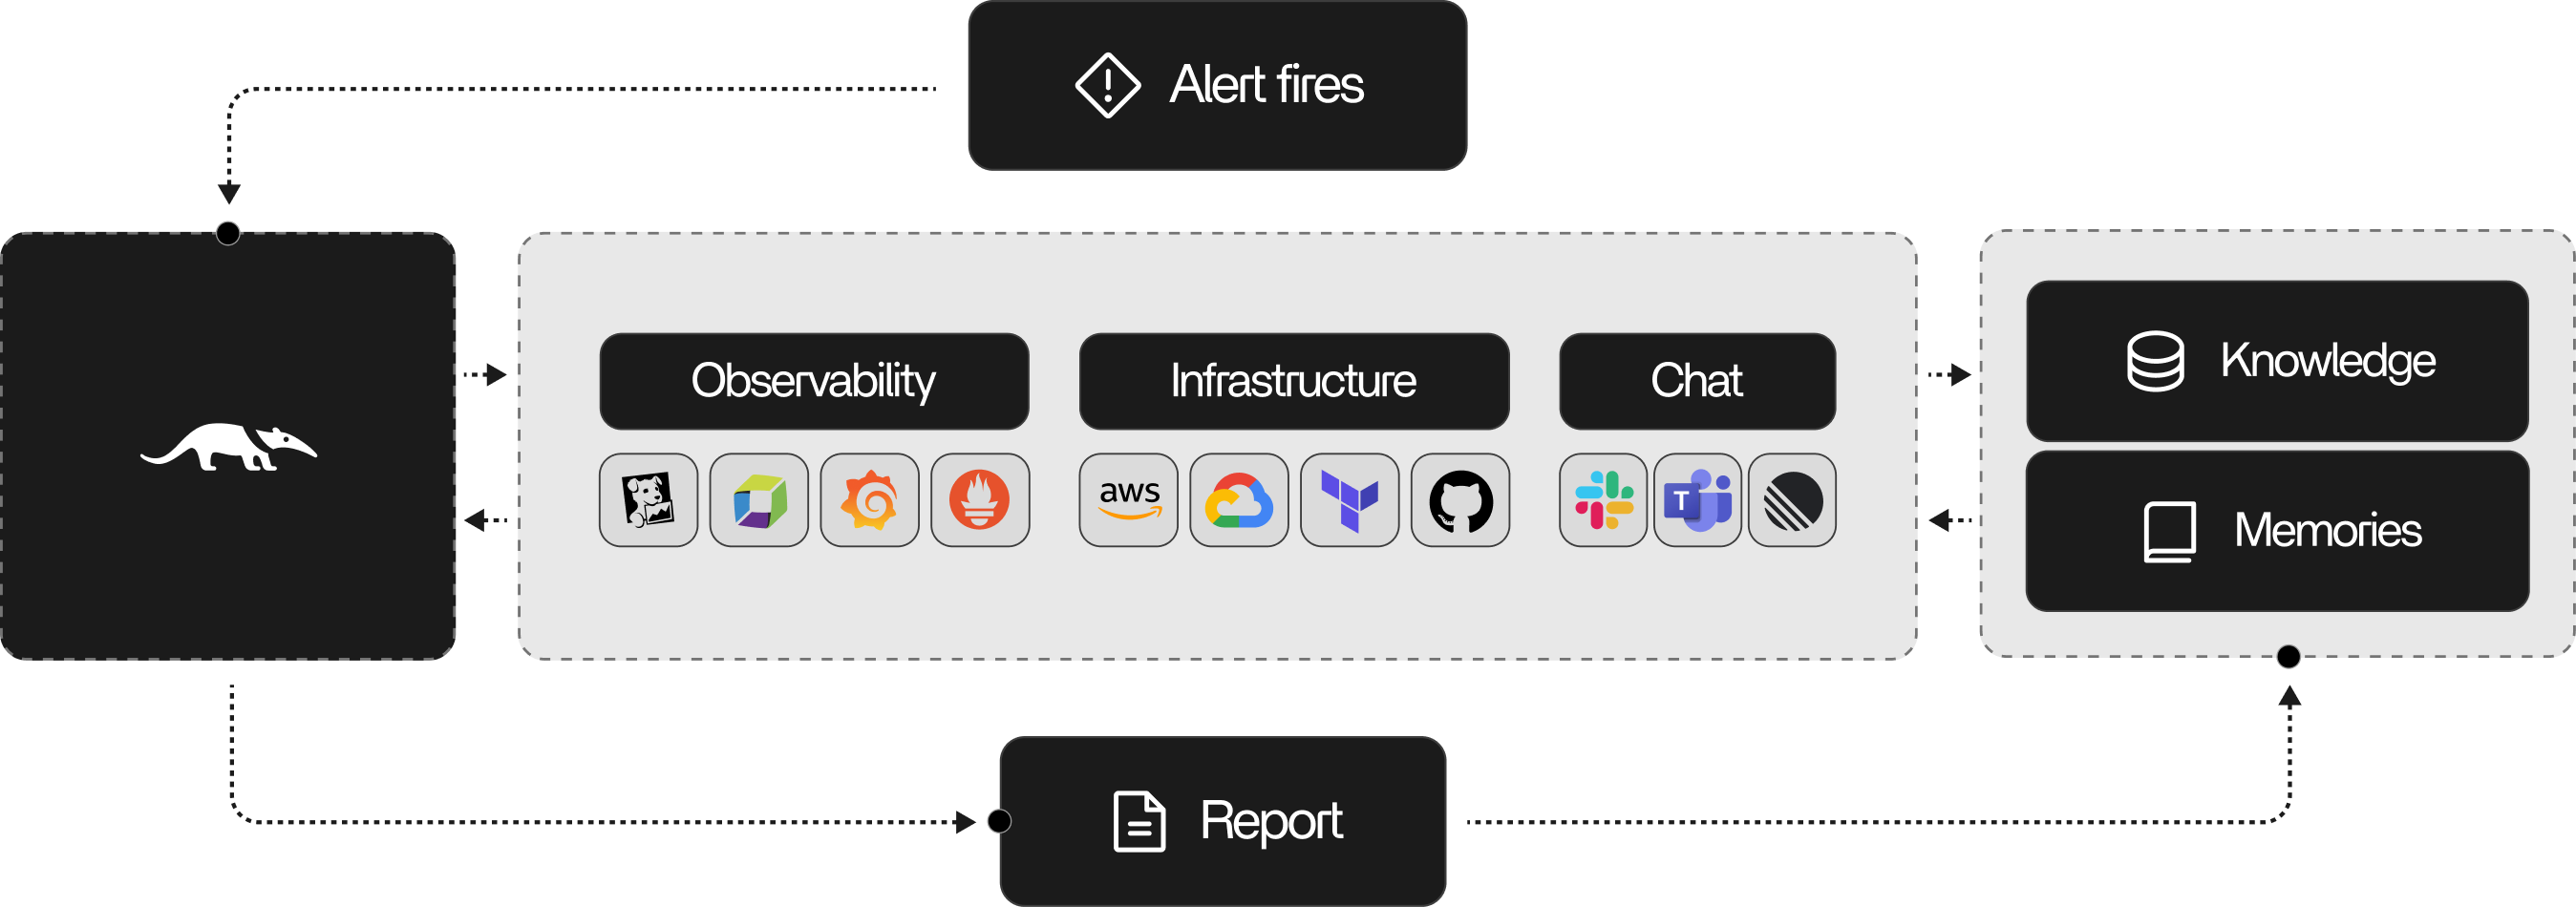
When an alert fires, OpenSRE autonomously:
1. **Ingests the alert** from metrics, logs, traces, or incident systems
2. **Assembles context** — ownership, deploys, dependencies, baselines
3. **Plans evidence collection** across connected integrations
4. **Investigates in a loop** — queries tools, updates hypotheses, stops when confidence is high enough
5. **Delivers a report** to Slack, local files, or your configured messaging channel
Investigation workflow
See [How an investigation works](/docs/how-investigations-work) for a plain-language walkthrough of each stage.