> ## Documentation Index
> Fetch the complete documentation index at: https://opensre.com/docs/llms.txt
> Use this file to discover all available pages before exploring further.
# Grafana
> Connect Grafana so OpenSRE can query metrics, dashboards, and alerts during investigations
OpenSRE queries Grafana (Cloud or self-hosted) for metrics, dashboard context, and alert annotations during investigations.
## Overview
1. [Grafana Cloud / self-hosted setup](#grafana-cloud--self-hosted-setup)
2. [Local Grafana Setup (Minikube example)](#local-grafana-setup-minikube-example)
## Grafana Cloud / self-hosted setup
### Prerequisites
* Grafana instance URL (Cloud stack URL or self-hosted origin)
* Service account token with read access — see [Grafana service account tokens](https://grafana.com/docs/grafana/latest/administration/service-accounts/#add-a-token-to-a-service-account-in-grafana)
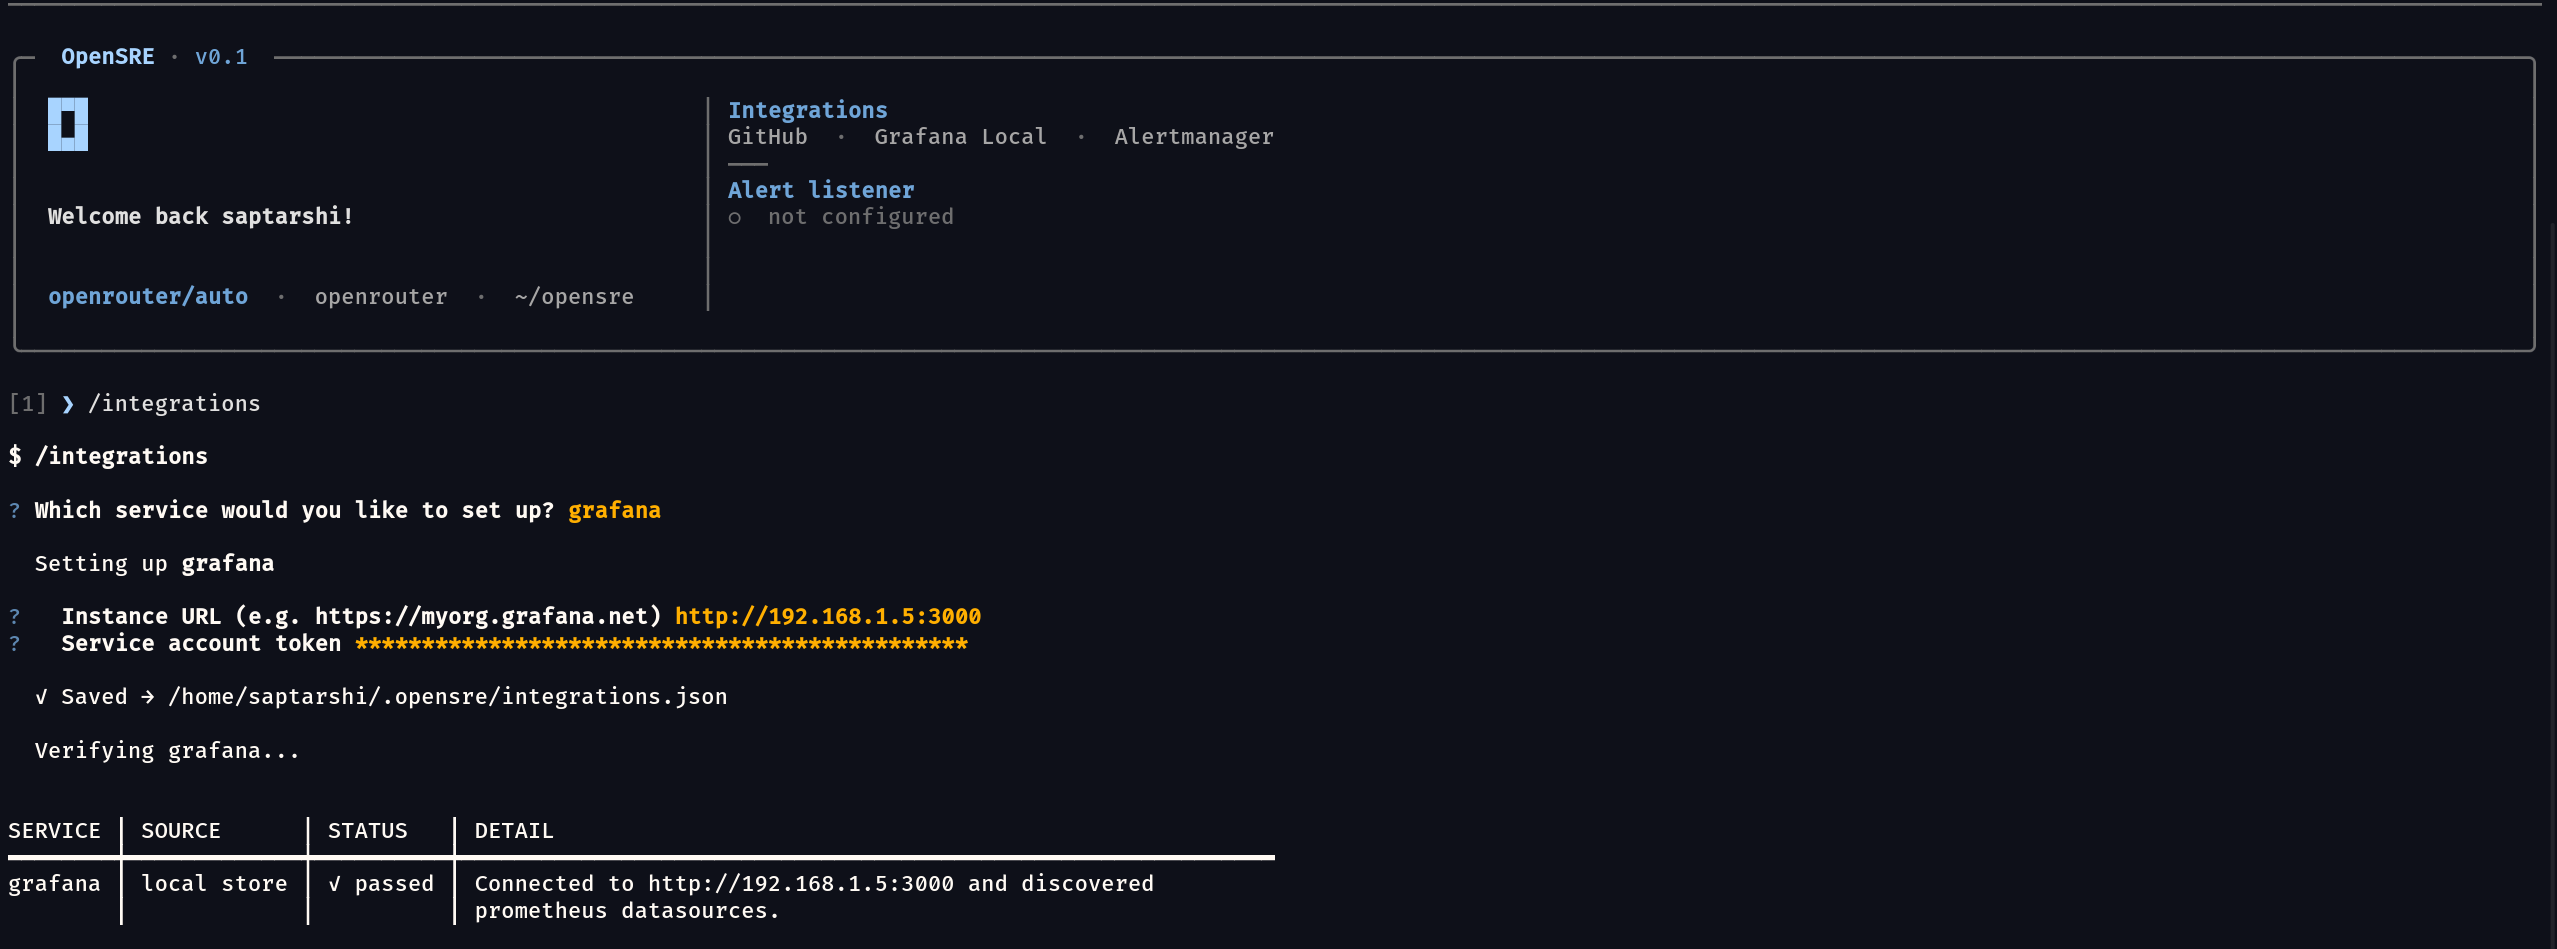
### Option 1: Interactive CLI
```bash theme={null}
opensre integrations setup grafana
```
Provide the instance URL and service account token when prompted.
### Option 2: Environment variables
```bash theme={null}
GRAFANA_INSTANCE_URL=https://your-stack.grafana.net
GRAFANA_READ_TOKEN=glsa_your_service_account_token
GRAFANA_VERIFY_SSL=true # optional — set false only for local/lab
GRAFANA_CA_BUNDLE=/path/to/internal-ca.pem # optional — internal CA
```
| Variable | Default | Description |
| ---------------------- | ------- | ---------------------------------------------------------- |
| `GRAFANA_INSTANCE_URL` | — | **Required.** Grafana base URL |
| `GRAFANA_READ_TOKEN` | — | **Required.** Service account token |
| `GRAFANA_VERIFY_SSL` | `true` | Set `false` to skip TLS verification (lab only) |
| `GRAFANA_CA_BUNDLE` | — | PEM file for private CA (recommended for internal Grafana) |
For prod/staging pairs, use `GRAFANA_INSTANCES` — see [Multi-instance integrations](/docs/multi-instance-integrations).
### Option 3: Persistent store
```json theme={null}
{
"version": 1,
"integrations": [
{
"id": "grafana-prod",
"service": "grafana",
"status": "active",
"credentials": {
"endpoint": "https://your-stack.grafana.net",
"api_key": "glsa_your_token",
"verify_ssl": true
}
}
]
}
```
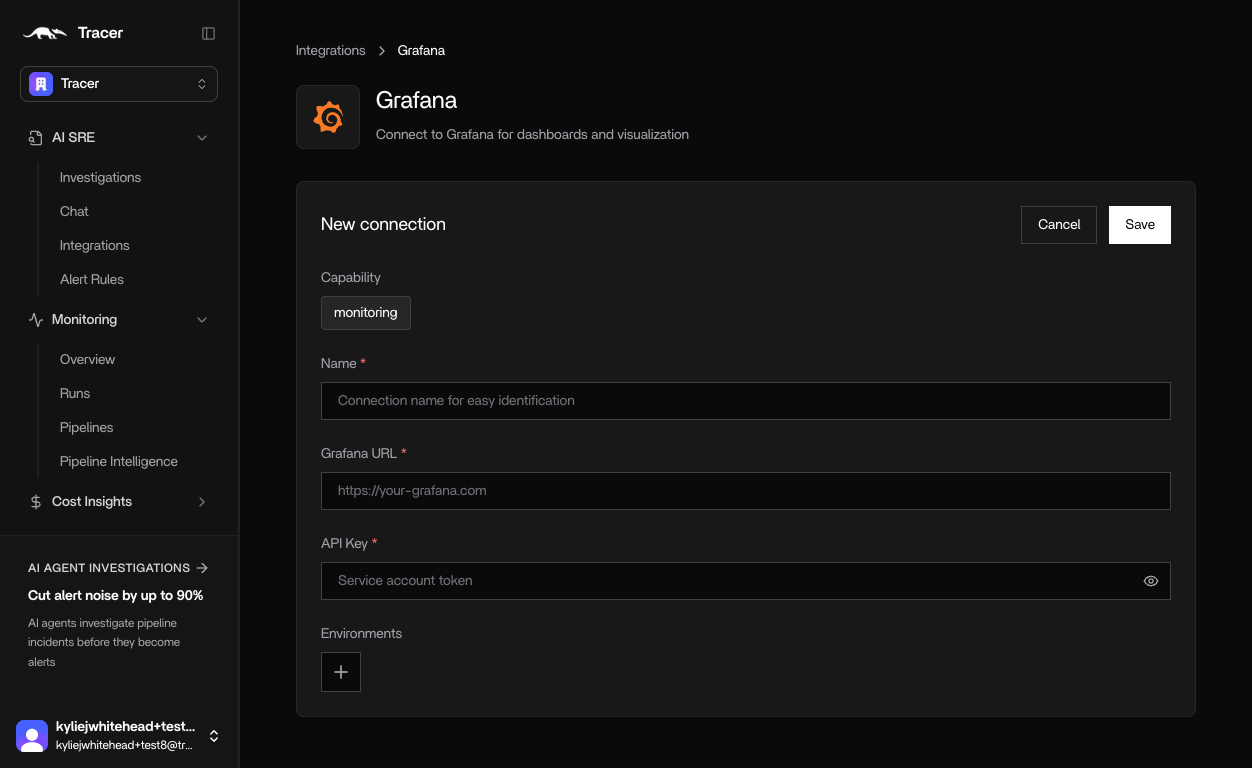
### Option 4: Hosted web app (OpenSRE Cloud)
1. In [app.tracer.cloud](https://app.tracer.cloud), go to **Integrations** → **Grafana**
2. Enter a name, instance URL, and service account token
3. Click **Save**
 ### Verify
```bash theme={null}
opensre integrations verify grafana
```
### Self-signed or internal CA certificates
If your Grafana instance is self-hosted behind a certificate signed by an internal/private
CA, `opensre onboard` will prompt:
* **Verify SSL certificate?** — answer `No` to skip TLS verification entirely (only
recommended for local/lab instances).
* **Path to CA bundle for SSL verification** — point this at a PEM file containing your
internal CA certificate to keep full TLS verification while trusting your organization's
CA. This is the recommended option for a real internal Grafana deployment, since it
still validates the certificate chain and hostname.
These can also be set directly via `GRAFANA_VERIFY_SSL` (`true`/`false`) and
`GRAFANA_CA_BUNDLE` (path to a PEM file) in `.env`.
## Local Grafana Setup (Minikube example)
### Steps
1. Start minikube:
```bash theme={null}
minikube start
```
2. Add prometheus community and podinfo helm repositories:
```bash theme={null}
helm repo add prometheus-community https://prometheus-community.github.io/helm-charts
helm repo add podinfo https://stefanprodan.github.io/podinfo
helm repo update
```
3. Create monitoring namespace and install kube-prometheus stack:
```bash theme={null}
kubectl create namespace monitoring
helm install kube-stack prometheus-community/kube-prometheus-stack -n monitoring
```
4. Create podinfo namespace and install podinfo application:
```bash theme={null}
kubectl create namespace podinfo
helm install podinfo podinfo/podinfo -n podinfo --set serviceMonitor.enabled=true
```
5. (Optional) Check the status of the pods in the podinfo and monitoring namespaces:
```bash theme={null}
kubectl -n podinfo get pods
kubectl -n monitoring get pods
```
6. (Run in separate terminals) Port forward the podinfo service:
```bash theme={null}
kubectl -n podinfo port-forward deploy/podinfo 8080:9898
```
7. (Run in separate terminals) Port forward the prometheus service:
```bash theme={null}
kubectl -n monitoring port-forward svc/kube-stack-kube-prometheus-prometheus 9090:9090
```
8. (Run in separate terminals) Port forward the grafana service and expose it on all network interfaces:
```bash theme={null}
kubectl -n monitoring port-forward --address 0.0.0.0 svc/kube-stack-grafana 3000:80
```
9. Patch the kube-stack-prometheus service to allow it to scrape the podinfo service:
```bash theme={null}
kubectl patch prometheus kube-stack-kube-prometheus-prometheus \
-n monitoring \
--type=merge \
-p '{"spec":{"serviceMonitorSelector":{},"serviceMonitorNamespaceSelector":{}}}'
```
### Credentials for Grafana
Run this command to get the Grafana admin password:
```bash theme={null}
kubectl get secret kube-stack-grafana --namespace monitoring -o jsonpath="{.data.admin-password}" | base64 --decode ; echo
```
The username is `admin` and the password is the output of the command above.
### Access
Access the:
* podinfo microservices application at [http://localhost:8080](http://localhost:8080)
* the prometheus dashboard at [http://localhost:9090](http://localhost:9090)
* the grafana dashboard at [http://localhost:3000](http://localhost:3000).
### Simulate load on the podinfo application
Open a new terminal and run the following command to simulate load on the podinfo application:
```bash theme={null}
while true; do curl -s http://localhost:8080/status/500 >/dev/null; sleep 1; done &
while true; do curl -s http://localhost:8080/delay/5 >/dev/null; sleep 1; done &
```
### Grafana Dashboard
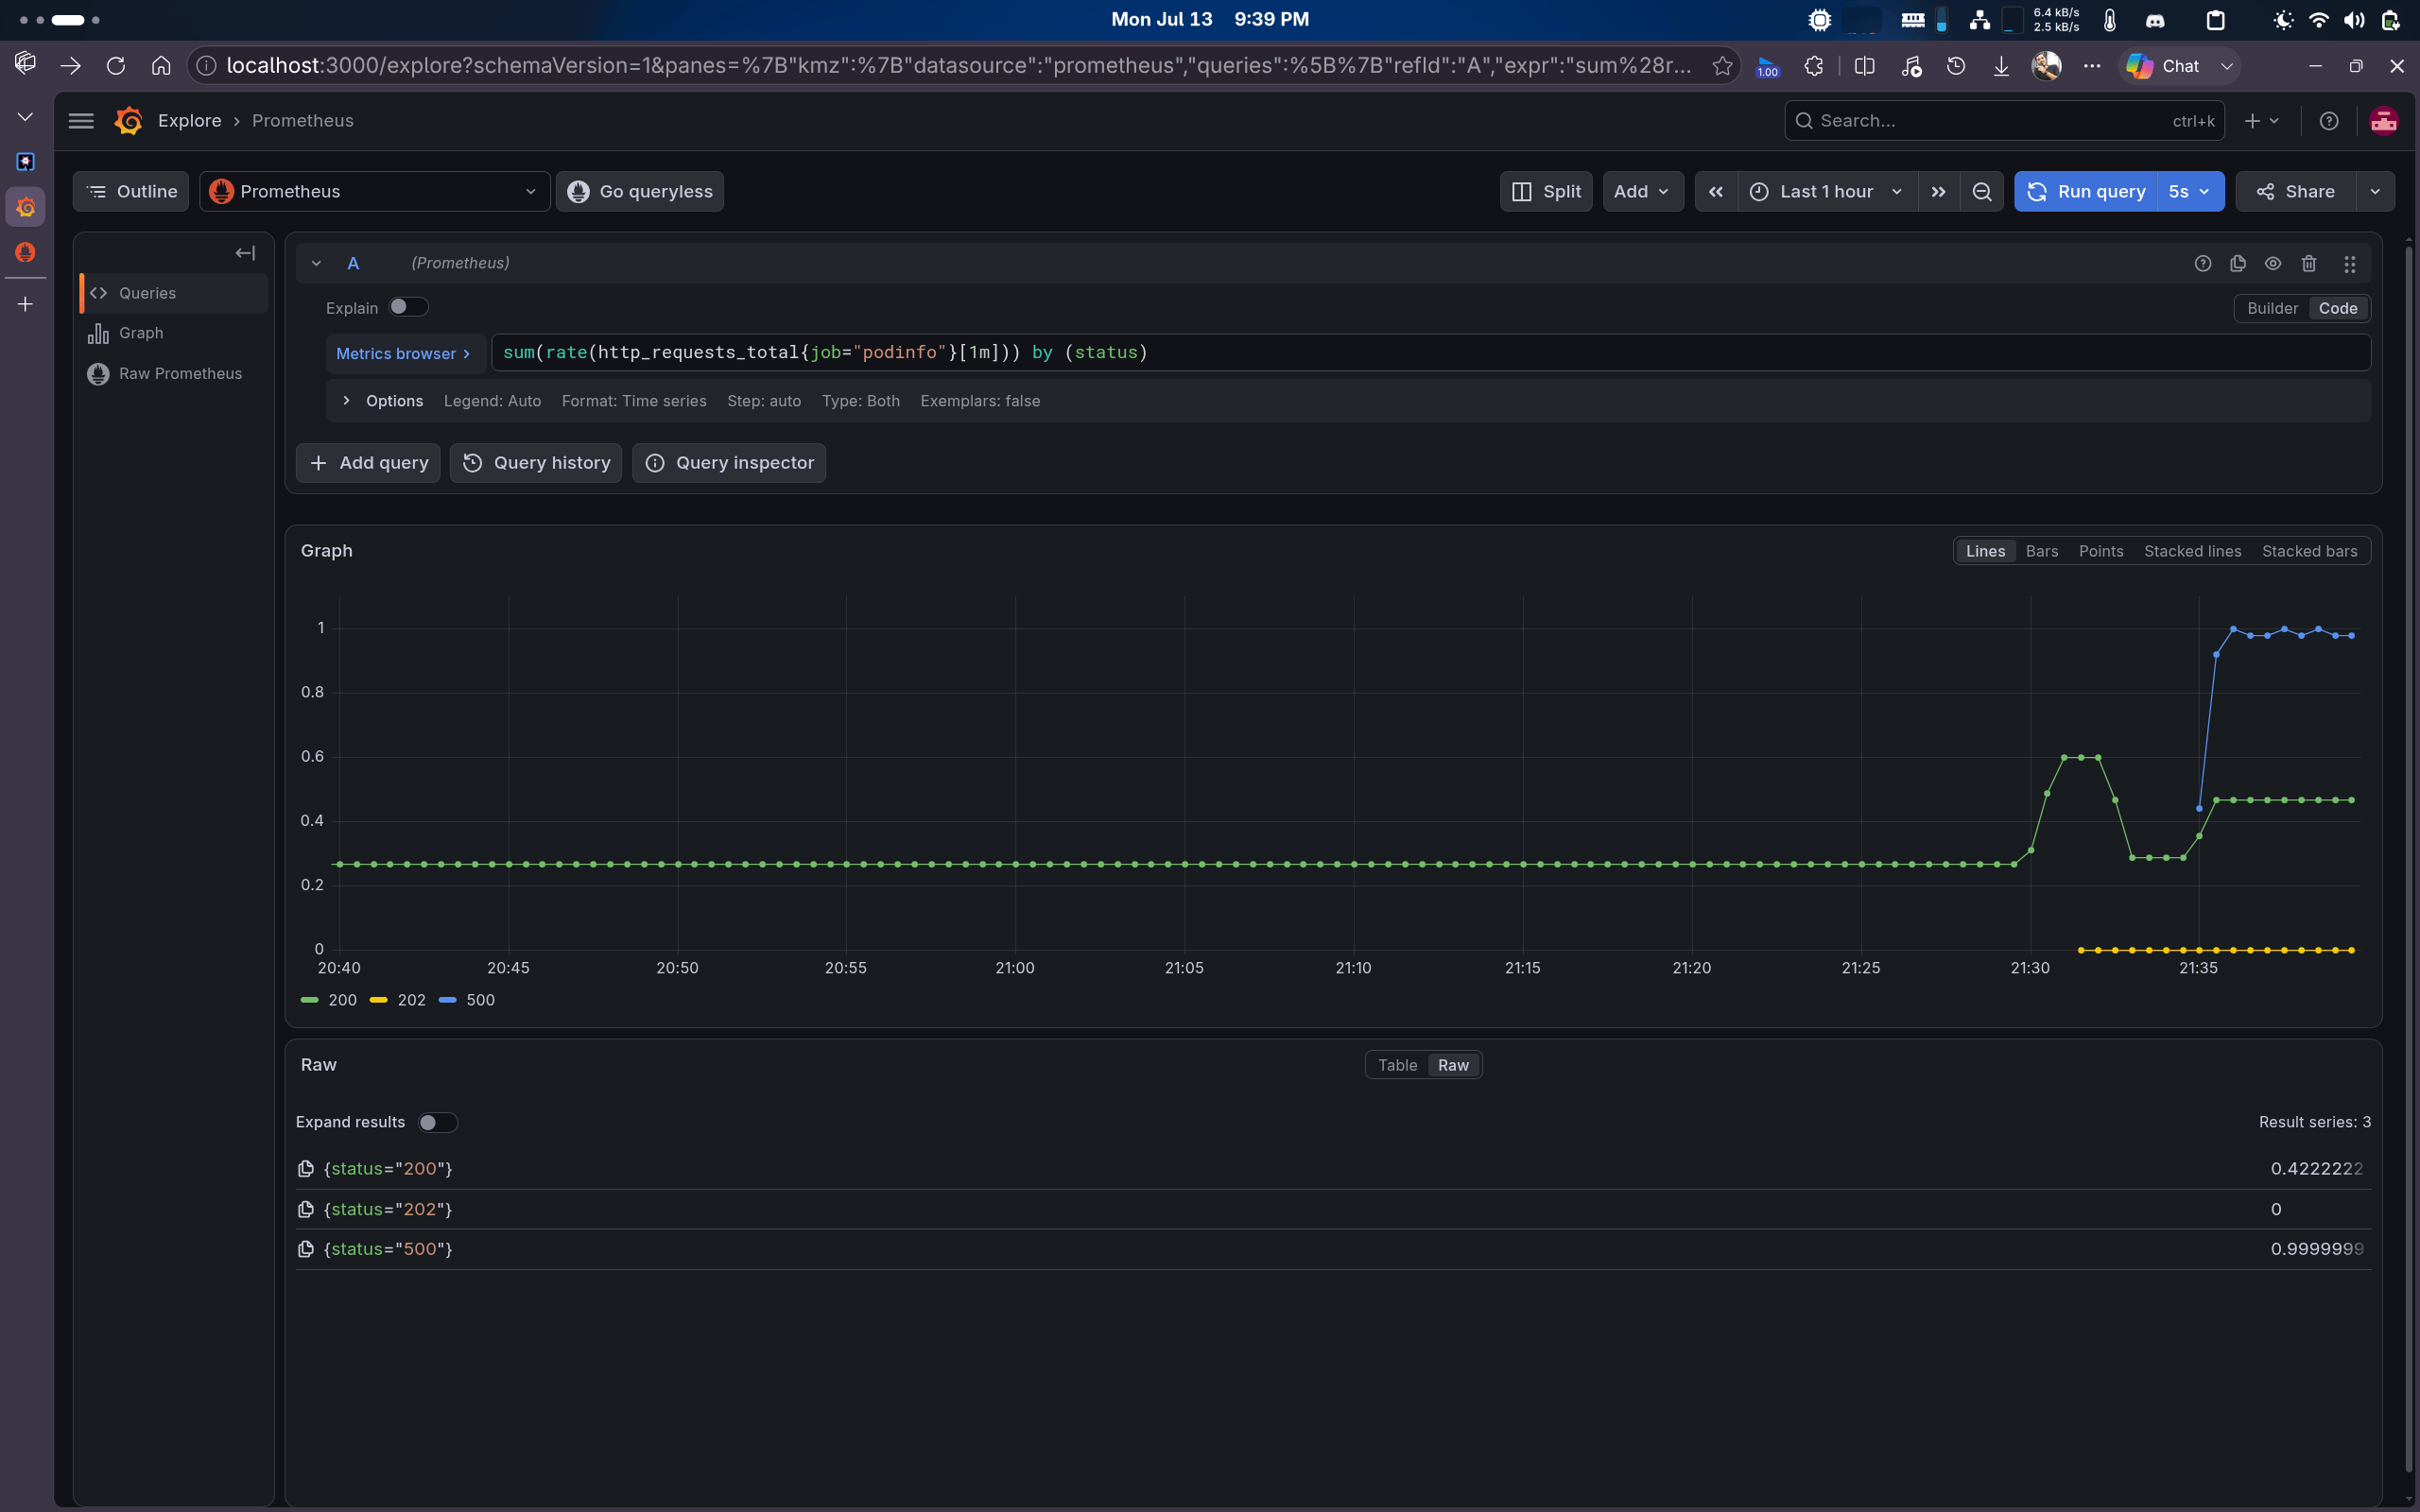
Run the following queries in the Grafana dashboard to visualize the metrics:
* For the number of requests to the podinfo application:
```promql theme={null}
sum(rate(http_requests_total{job="podinfo"}[1m])) by (status)
```
* For the average response time of the podinfo application:
```promql theme={null}
histogram_quantile(0.95, sum(rate(http_request_duration_seconds_bucket{job="podinfo"}[1m])) by (le))
```
### Verify
```bash theme={null}
opensre integrations verify grafana
```
### Self-signed or internal CA certificates
If your Grafana instance is self-hosted behind a certificate signed by an internal/private
CA, `opensre onboard` will prompt:
* **Verify SSL certificate?** — answer `No` to skip TLS verification entirely (only
recommended for local/lab instances).
* **Path to CA bundle for SSL verification** — point this at a PEM file containing your
internal CA certificate to keep full TLS verification while trusting your organization's
CA. This is the recommended option for a real internal Grafana deployment, since it
still validates the certificate chain and hostname.
These can also be set directly via `GRAFANA_VERIFY_SSL` (`true`/`false`) and
`GRAFANA_CA_BUNDLE` (path to a PEM file) in `.env`.
## Local Grafana Setup (Minikube example)
### Steps
1. Start minikube:
```bash theme={null}
minikube start
```
2. Add prometheus community and podinfo helm repositories:
```bash theme={null}
helm repo add prometheus-community https://prometheus-community.github.io/helm-charts
helm repo add podinfo https://stefanprodan.github.io/podinfo
helm repo update
```
3. Create monitoring namespace and install kube-prometheus stack:
```bash theme={null}
kubectl create namespace monitoring
helm install kube-stack prometheus-community/kube-prometheus-stack -n monitoring
```
4. Create podinfo namespace and install podinfo application:
```bash theme={null}
kubectl create namespace podinfo
helm install podinfo podinfo/podinfo -n podinfo --set serviceMonitor.enabled=true
```
5. (Optional) Check the status of the pods in the podinfo and monitoring namespaces:
```bash theme={null}
kubectl -n podinfo get pods
kubectl -n monitoring get pods
```
6. (Run in separate terminals) Port forward the podinfo service:
```bash theme={null}
kubectl -n podinfo port-forward deploy/podinfo 8080:9898
```
7. (Run in separate terminals) Port forward the prometheus service:
```bash theme={null}
kubectl -n monitoring port-forward svc/kube-stack-kube-prometheus-prometheus 9090:9090
```
8. (Run in separate terminals) Port forward the grafana service and expose it on all network interfaces:
```bash theme={null}
kubectl -n monitoring port-forward --address 0.0.0.0 svc/kube-stack-grafana 3000:80
```
9. Patch the kube-stack-prometheus service to allow it to scrape the podinfo service:
```bash theme={null}
kubectl patch prometheus kube-stack-kube-prometheus-prometheus \
-n monitoring \
--type=merge \
-p '{"spec":{"serviceMonitorSelector":{},"serviceMonitorNamespaceSelector":{}}}'
```
### Credentials for Grafana
Run this command to get the Grafana admin password:
```bash theme={null}
kubectl get secret kube-stack-grafana --namespace monitoring -o jsonpath="{.data.admin-password}" | base64 --decode ; echo
```
The username is `admin` and the password is the output of the command above.
### Access
Access the:
* podinfo microservices application at [http://localhost:8080](http://localhost:8080)
* the prometheus dashboard at [http://localhost:9090](http://localhost:9090)
* the grafana dashboard at [http://localhost:3000](http://localhost:3000).
### Simulate load on the podinfo application
Open a new terminal and run the following command to simulate load on the podinfo application:
```bash theme={null}
while true; do curl -s http://localhost:8080/status/500 >/dev/null; sleep 1; done &
while true; do curl -s http://localhost:8080/delay/5 >/dev/null; sleep 1; done &
```
### Grafana Dashboard
Run the following queries in the Grafana dashboard to visualize the metrics:
* For the number of requests to the podinfo application:
```promql theme={null}
sum(rate(http_requests_total{job="podinfo"}[1m])) by (status)
```
* For the average response time of the podinfo application:
```promql theme={null}
histogram_quantile(0.95, sum(rate(http_request_duration_seconds_bucket{job="podinfo"}[1m])) by (le))
```
 ### Setting up Prometheus Alerts
Run this command to create a Prometheus alert for the podinfo application which triggers when the error rate is high:
```bash theme={null}
kubectl apply -f - <<'YAML'
apiVersion: monitoring.coreos.com/v1
kind: PrometheusRule
metadata:
name: podinfo-alerts
namespace: monitoring
labels:
release: kube-stack
spec:
groups:
- name: podinfo.rules
rules:
- alert: PodinfoHighErrorRate
expr: increase(http_requests_total{status="500"}[5m]) > 5
for: 30s
labels:
severity: critical
annotations:
summary: "Podinfo error rate is high"
YAML
```
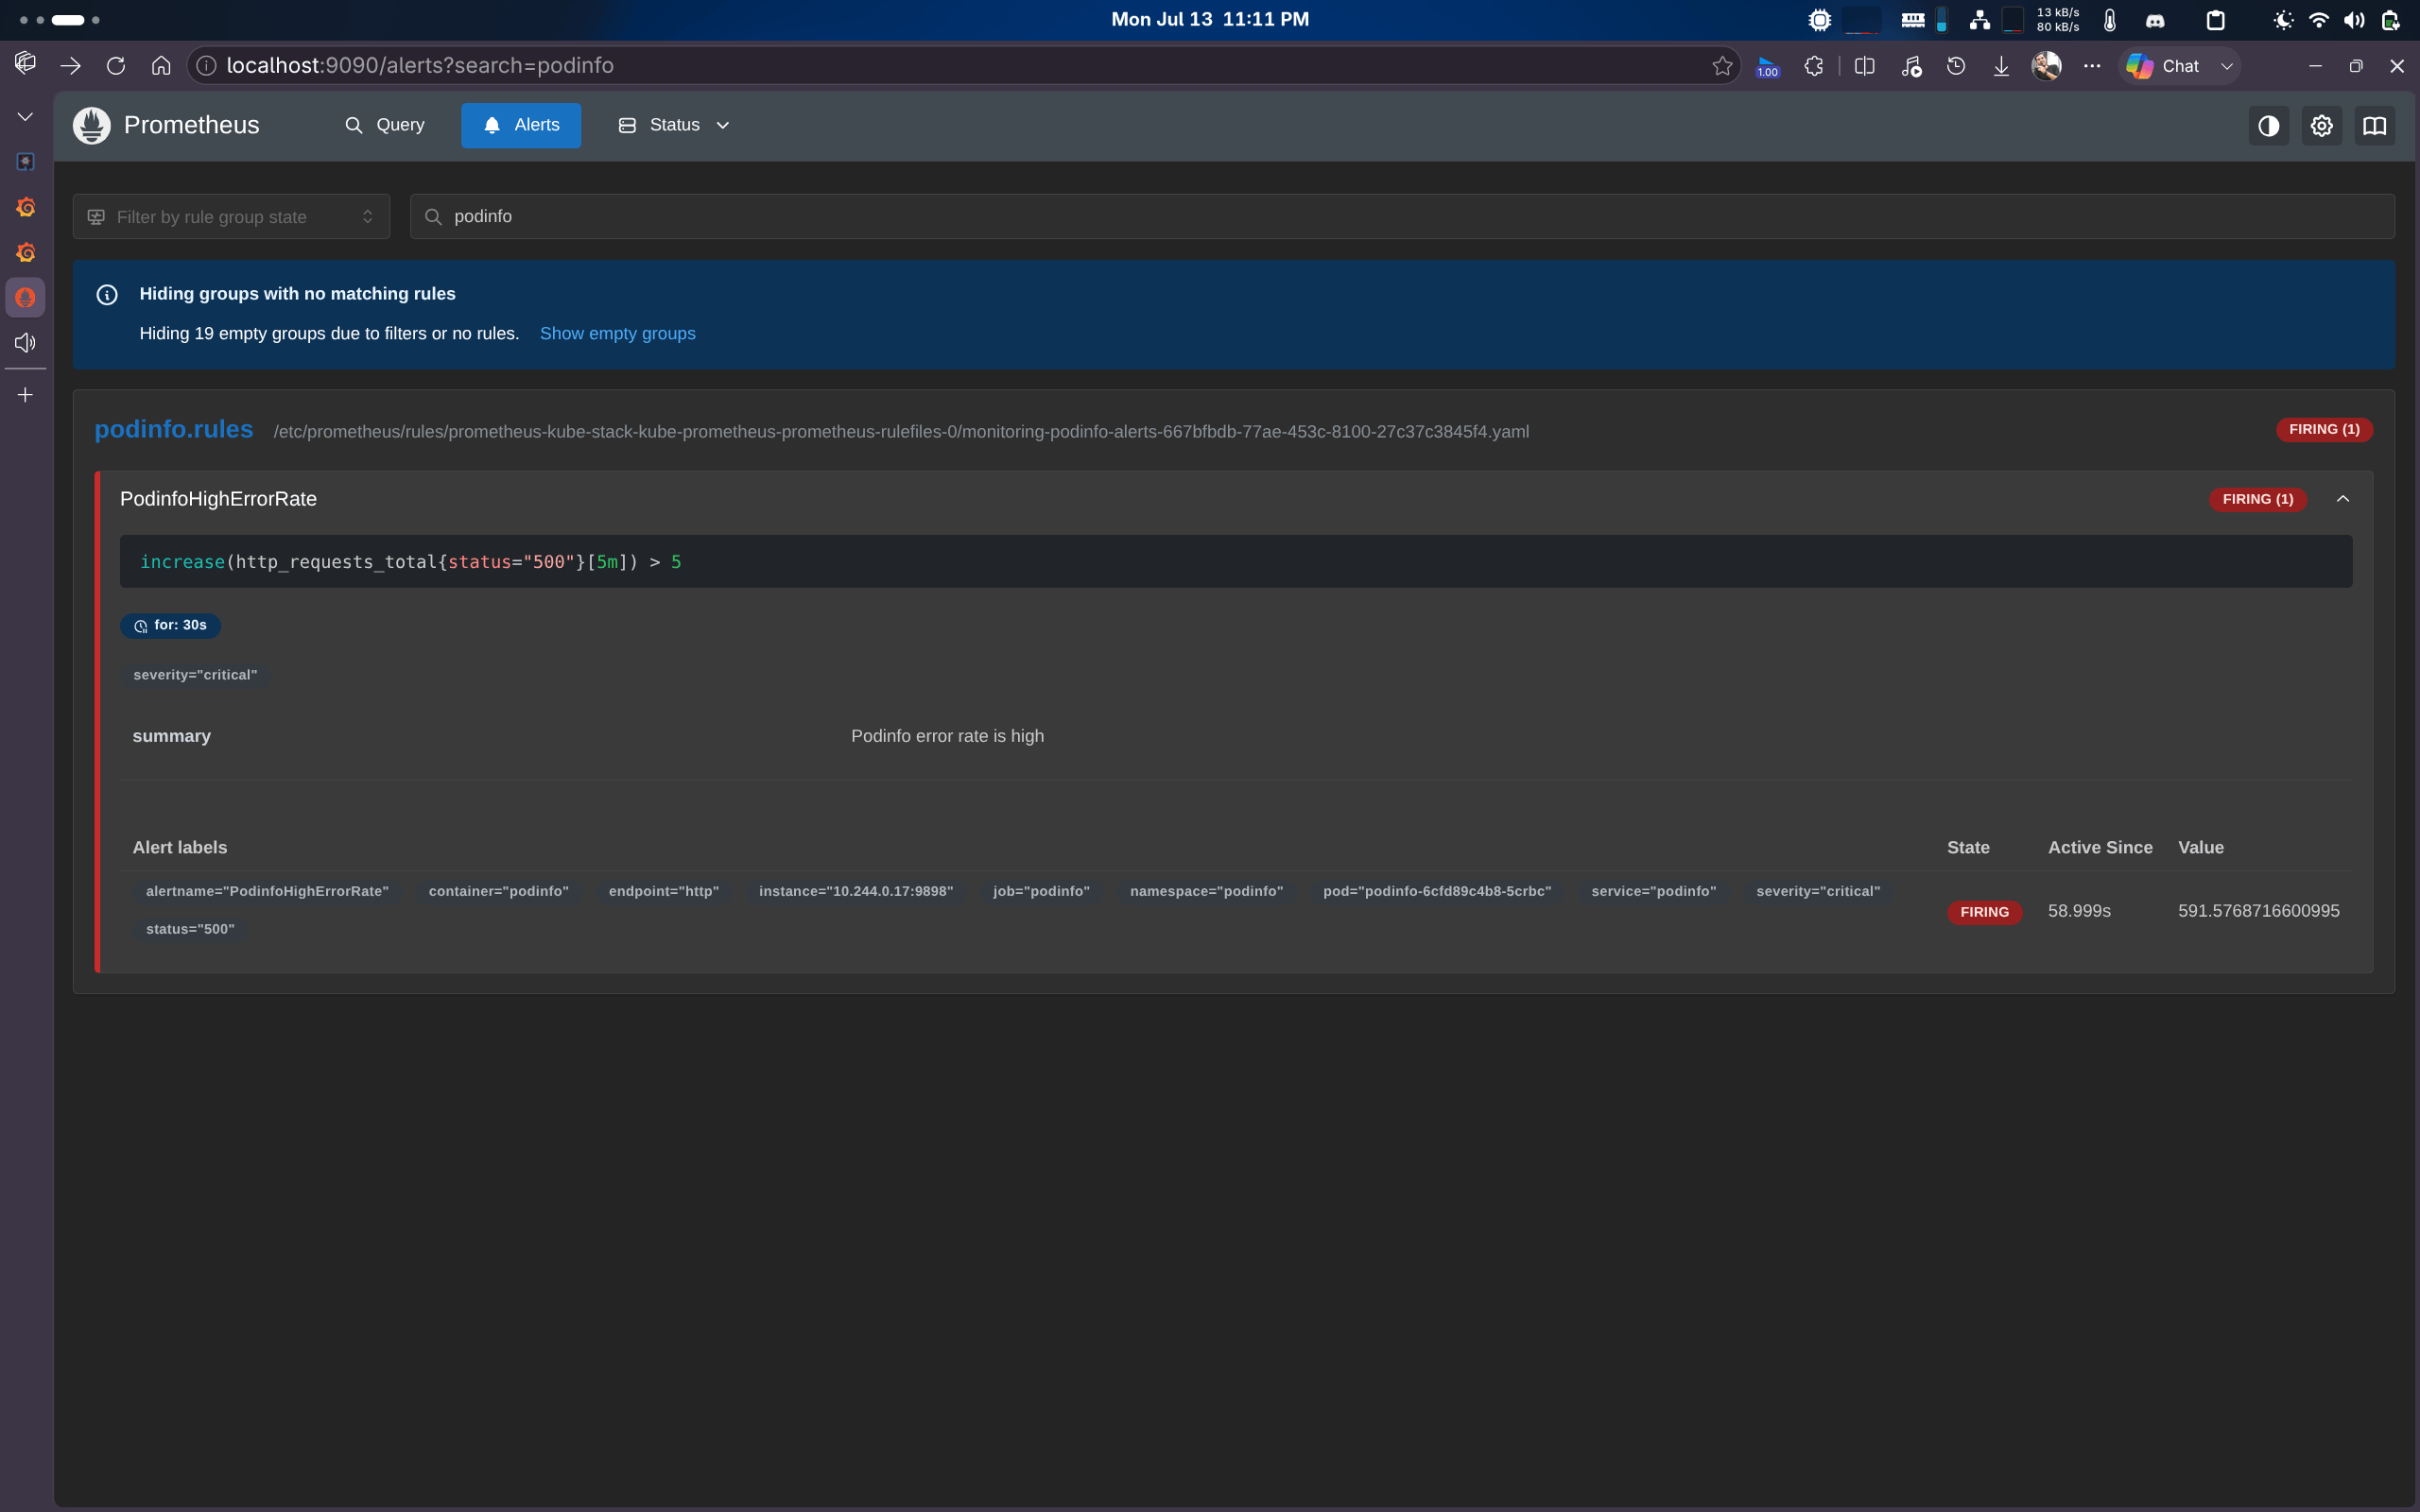
The prometheus alert will be fired after 30 seconds of the error rate being high. You can check the alert in the prometheus dashboard at [http://localhost:9090/alerts](http://localhost:9090/alerts).
### Setting up Prometheus Alerts
Run this command to create a Prometheus alert for the podinfo application which triggers when the error rate is high:
```bash theme={null}
kubectl apply -f - <<'YAML'
apiVersion: monitoring.coreos.com/v1
kind: PrometheusRule
metadata:
name: podinfo-alerts
namespace: monitoring
labels:
release: kube-stack
spec:
groups:
- name: podinfo.rules
rules:
- alert: PodinfoHighErrorRate
expr: increase(http_requests_total{status="500"}[5m]) > 5
for: 30s
labels:
severity: critical
annotations:
summary: "Podinfo error rate is high"
YAML
```
The prometheus alert will be fired after 30 seconds of the error rate being high. You can check the alert in the prometheus dashboard at [http://localhost:9090/alerts](http://localhost:9090/alerts).
 ### Integrating with OpenSRE
1. Get the LAN IP address of your machine:
```bash theme={null}
hostname -I | awk '{print $1}' #linux
ipconfig getifaddr en0 #macOS
(Get-NetIPAddress -InterfaceAlias "Wi-Fi" -AddressFamily IPv4).IPAddress #Windows PowerShell
# Remember to replace "Wi-Fi" with the name of your network interface if it's different.
```
2. Create a service account token in Grafana following the official documentation: [ How to add a token to a service account in Grafana](https://grafana.com/docs/grafana/latest/administration/service-accounts/#add-a-token-to-a-service-account-in-grafana)
3. Run opensre integration add grafana and follow the prompts to enter the required information:
* Instance URL: Enter the endpoint URL for your Grafana instance (e.g., `http://:3000`)
* Service account token: Paste the Service Account token you created in Grafana
### Integrating with OpenSRE
1. Get the LAN IP address of your machine:
```bash theme={null}
hostname -I | awk '{print $1}' #linux
ipconfig getifaddr en0 #macOS
(Get-NetIPAddress -InterfaceAlias "Wi-Fi" -AddressFamily IPv4).IPAddress #Windows PowerShell
# Remember to replace "Wi-Fi" with the name of your network interface if it's different.
```
2. Create a service account token in Grafana following the official documentation: [ How to add a token to a service account in Grafana](https://grafana.com/docs/grafana/latest/administration/service-accounts/#add-a-token-to-a-service-account-in-grafana)
3. Run opensre integration add grafana and follow the prompts to enter the required information:
* Instance URL: Enter the endpoint URL for your Grafana instance (e.g., `http://:3000`)
* Service account token: Paste the Service Account token you created in Grafana