> ## Documentation Index
> Fetch the complete documentation index at: https://opensre.com/docs/llms.txt
> Use this file to discover all available pages before exploring further.
# Datadog
> Connect Datadog so OpenSRE can query logs, metrics, monitors, and events during investigations
OpenSRE queries Datadog during alert investigations — pulling logs, metrics, monitor state, and events correlated with incidents.
## Prerequisites
* Datadog account with API access
* API key (organization settings)
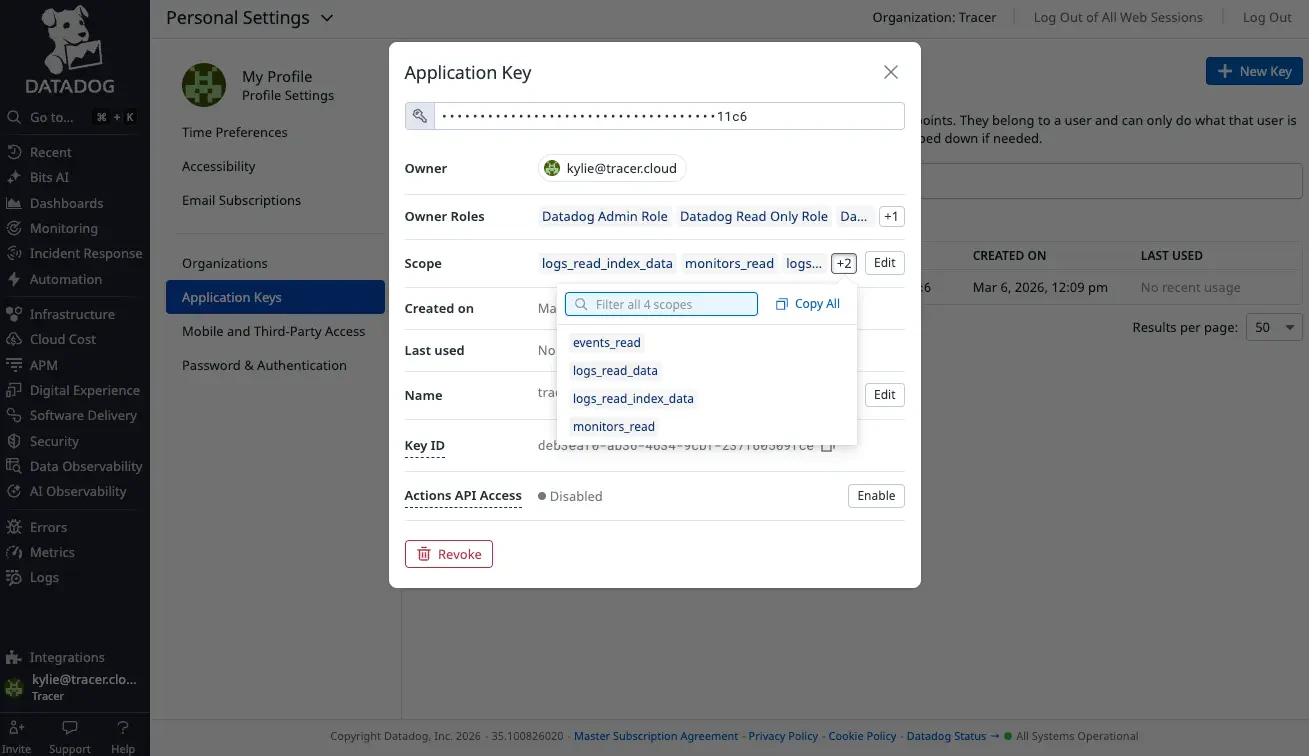
* Application key with read scopes (`events_read`, `logs_read_data`, `logs_read_index_data`, `monitors_read`)
## Setup
### Option 1: Interactive CLI
```bash theme={null}
opensre integrations setup datadog
```
Or run the onboarding wizard and select **Datadog**. You will be prompted for API key, application key, and site (for example `datadoghq.com` or `datadoghq.eu`).
### Option 2: Environment variables
Add to your `.env`:
```bash theme={null}
DD_API_KEY=your-api-key
DD_APP_KEY=your-application-key
DD_SITE=datadoghq.com # optional — default datadoghq.com; use datadoghq.eu for EU
```
| Variable | Default | Description |
| ------------ | --------------- | ------------------------------------------ |
| `DD_API_KEY` | — | **Required.** Datadog API key |
| `DD_APP_KEY` | — | **Required.** Datadog application key |
| `DD_SITE` | `datadoghq.com` | Datadog site hostname (EU: `datadoghq.eu`) |
For multiple Datadog orgs or sites, use [multi-instance](/docs/multi-instance-integrations) with `DD_INSTANCES`.
### Option 3: Persistent store
```json theme={null}
{
"version": 1,
"integrations": [
{
"id": "datadog-prod",
"service": "datadog",
"status": "active",
"credentials": {
"api_key": "your-api-key",
"app_key": "your-application-key",
"site": "datadoghq.com"
}
}
]
}
```
### Option 4: Hosted web app (OpenSRE Cloud)
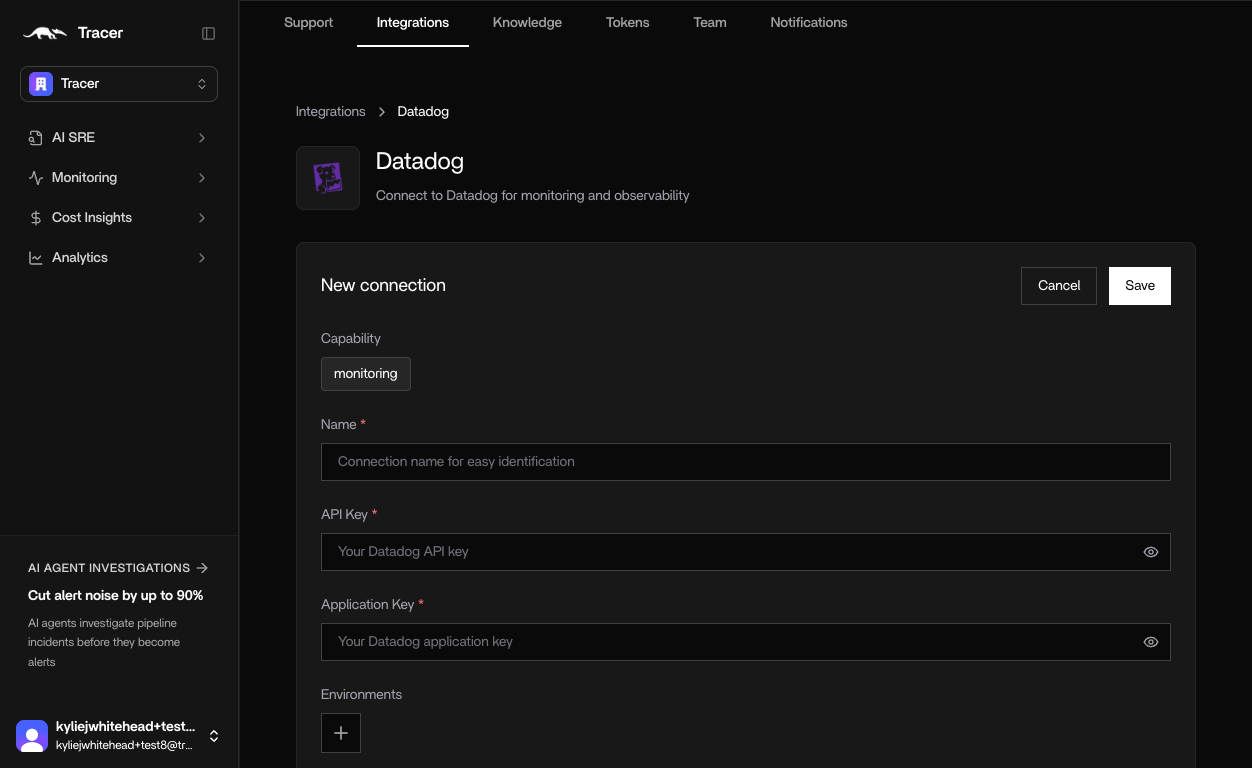
In [app.tracer.cloud](https://app.tracer.cloud), go to **Integrations** → **Datadog**, enter a name, and paste your API and application keys.
 ## Creating Datadog keys
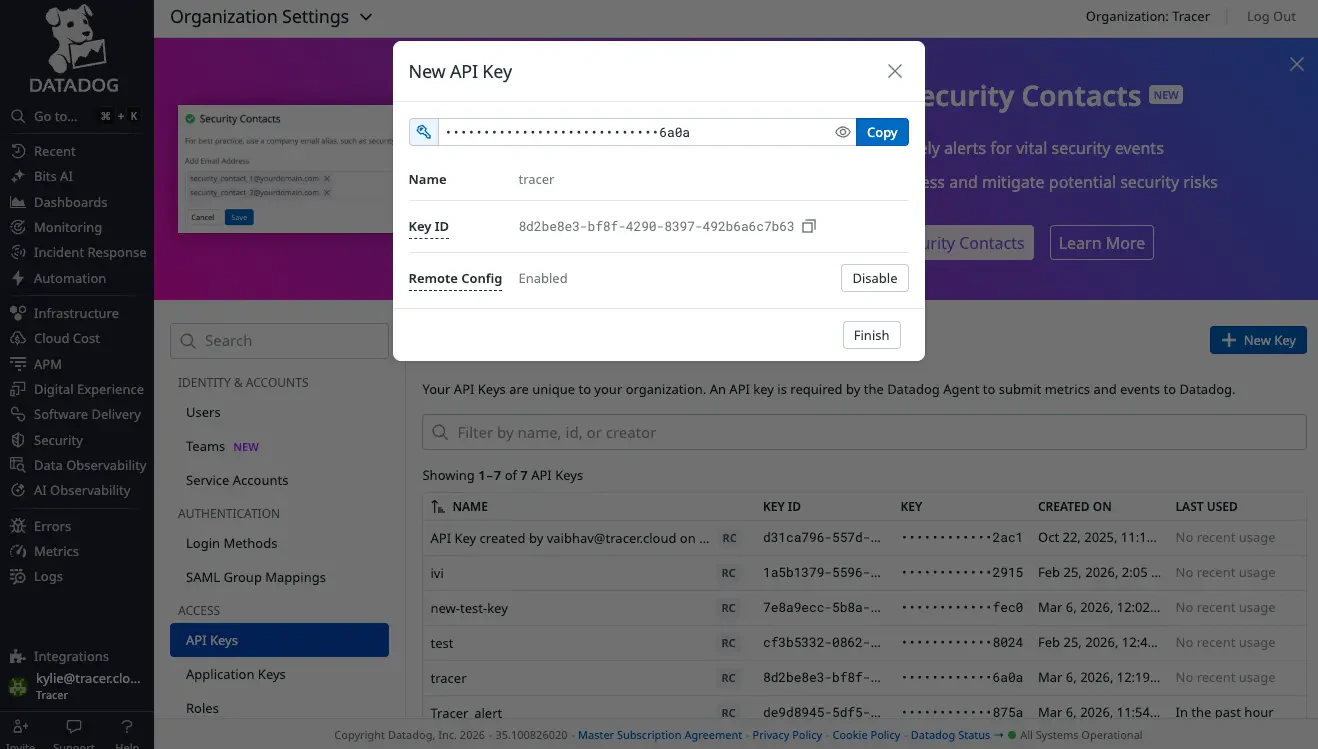
### API key
1. In Datadog, go to **Organization Settings** → **API Keys** ([direct link](https://app.datadoghq.com/organization-settings/api-keys))
2. Click **+ New Key** and name it (for example `opensre`)
3. Copy the key
## Creating Datadog keys
### API key
1. In Datadog, go to **Organization Settings** → **API Keys** ([direct link](https://app.datadoghq.com/organization-settings/api-keys))
2. Click **+ New Key** and name it (for example `opensre`)
3. Copy the key
 ### Application key
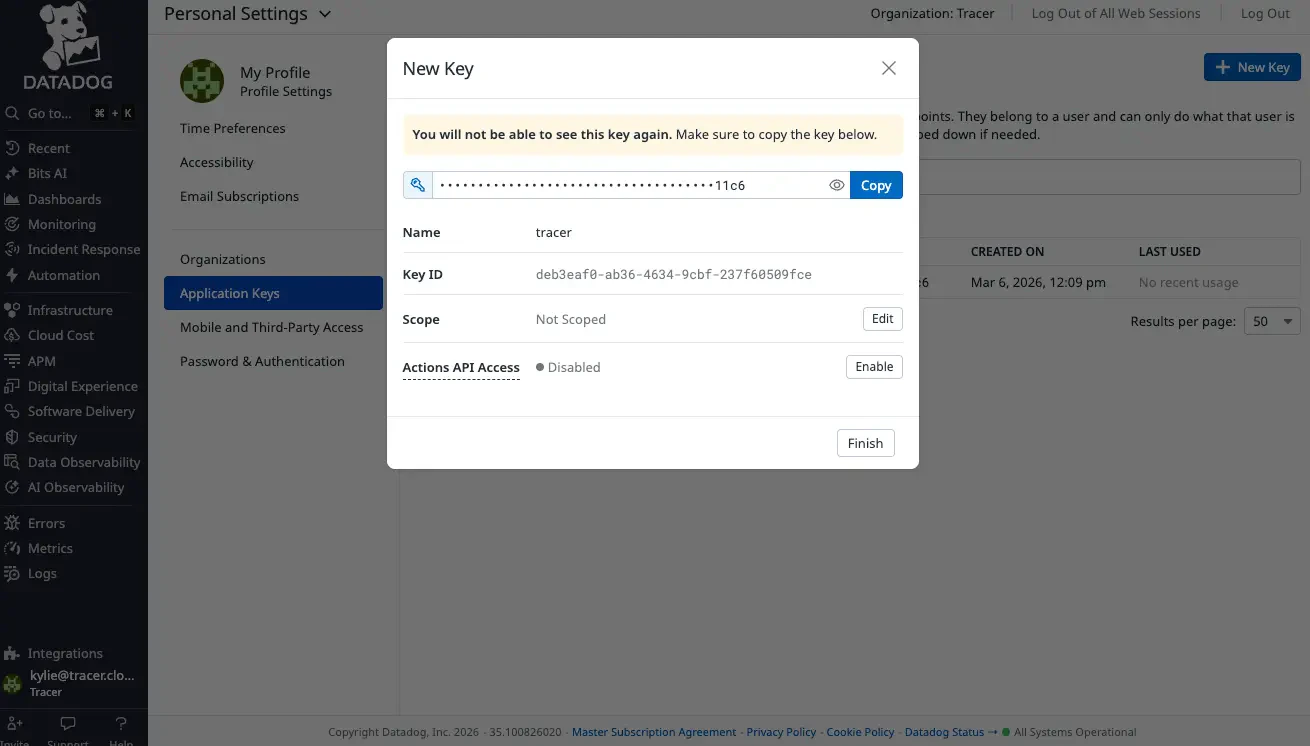
1. Go to **User Settings** → **Application Keys** ([direct link](https://app.datadoghq.com/personal-settings/application-keys))
2. Click **+ New Key** and name it (for example `opensre`)
3. Under **Edit Scope**, enable at minimum: `events_read`, `logs_read_data`, `logs_read_index_data`, `monitors_read`
4. Under **Actions API Access**, click **Enable**
5. Copy the key
### Application key
1. Go to **User Settings** → **Application Keys** ([direct link](https://app.datadoghq.com/personal-settings/application-keys))
2. Click **+ New Key** and name it (for example `opensre`)
3. Under **Edit Scope**, enable at minimum: `events_read`, `logs_read_data`, `logs_read_index_data`, `monitors_read`
4. Under **Actions API Access**, click **Enable**
5. Copy the key
 Some Datadog UI labels still say **tracer** from the Tracer→OpenSRE transition. Any key name works — use `opensre` for clarity.
## Verify
```bash theme={null}
opensre integrations verify datadog
```
Expected output:
```
Service: datadog
Status: passed
Detail: Connected to datadoghq.com and validated API access
```
Inside the REPL: `/integrations verify datadog` or `/verify datadog`.
## Troubleshooting
| Symptom | Fix |
| ---------------------------------------------- | ------------------------------------------------------------------------------------ |
| **403 Forbidden** | Confirm application key scopes include `logs_read_data` and `monitors_read` |
| **Wrong site / EU account** | Set `DD_SITE=datadoghq.eu` (or your site hostname) |
| **Verify passes but no logs in investigation** | Check index retention and that the app key can read the target log index |
| **Multiple Datadog accounts** | Use `DD_INSTANCES` — see [Multi-instance integrations](/docs/multi-instance-integrations) |
## Security best practices
* Create a dedicated application key with read-only scopes for investigations.
* Store keys in `.env` or your secret manager — not in source control.
Some Datadog UI labels still say **tracer** from the Tracer→OpenSRE transition. Any key name works — use `opensre` for clarity.
## Verify
```bash theme={null}
opensre integrations verify datadog
```
Expected output:
```
Service: datadog
Status: passed
Detail: Connected to datadoghq.com and validated API access
```
Inside the REPL: `/integrations verify datadog` or `/verify datadog`.
## Troubleshooting
| Symptom | Fix |
| ---------------------------------------------- | ------------------------------------------------------------------------------------ |
| **403 Forbidden** | Confirm application key scopes include `logs_read_data` and `monitors_read` |
| **Wrong site / EU account** | Set `DD_SITE=datadoghq.eu` (or your site hostname) |
| **Verify passes but no logs in investigation** | Check index retention and that the app key can read the target log index |
| **Multiple Datadog accounts** | Use `DD_INSTANCES` — see [Multi-instance integrations](/docs/multi-instance-integrations) |
## Security best practices
* Create a dedicated application key with read-only scopes for investigations.
* Store keys in `.env` or your secret manager — not in source control.